


I have a sales workbook that has five sheets. Transactions on one, products on another, then salespeople, regions, and a calendar, each maintained separately because that is how the data arrives. The usual fixes are a column of lookup formulas or a formula that stacks the separate sheets into one long list, and both leave you maintaining the join by hand.
Excel already ships with something better. The Data Model is a compressed relational store held inside the workbook itself, and once the relationships are in place, one PivotTable reads all five sheets at once.
Table relationships replace your lookup columns
Drag one key onto another, and the formulas go away


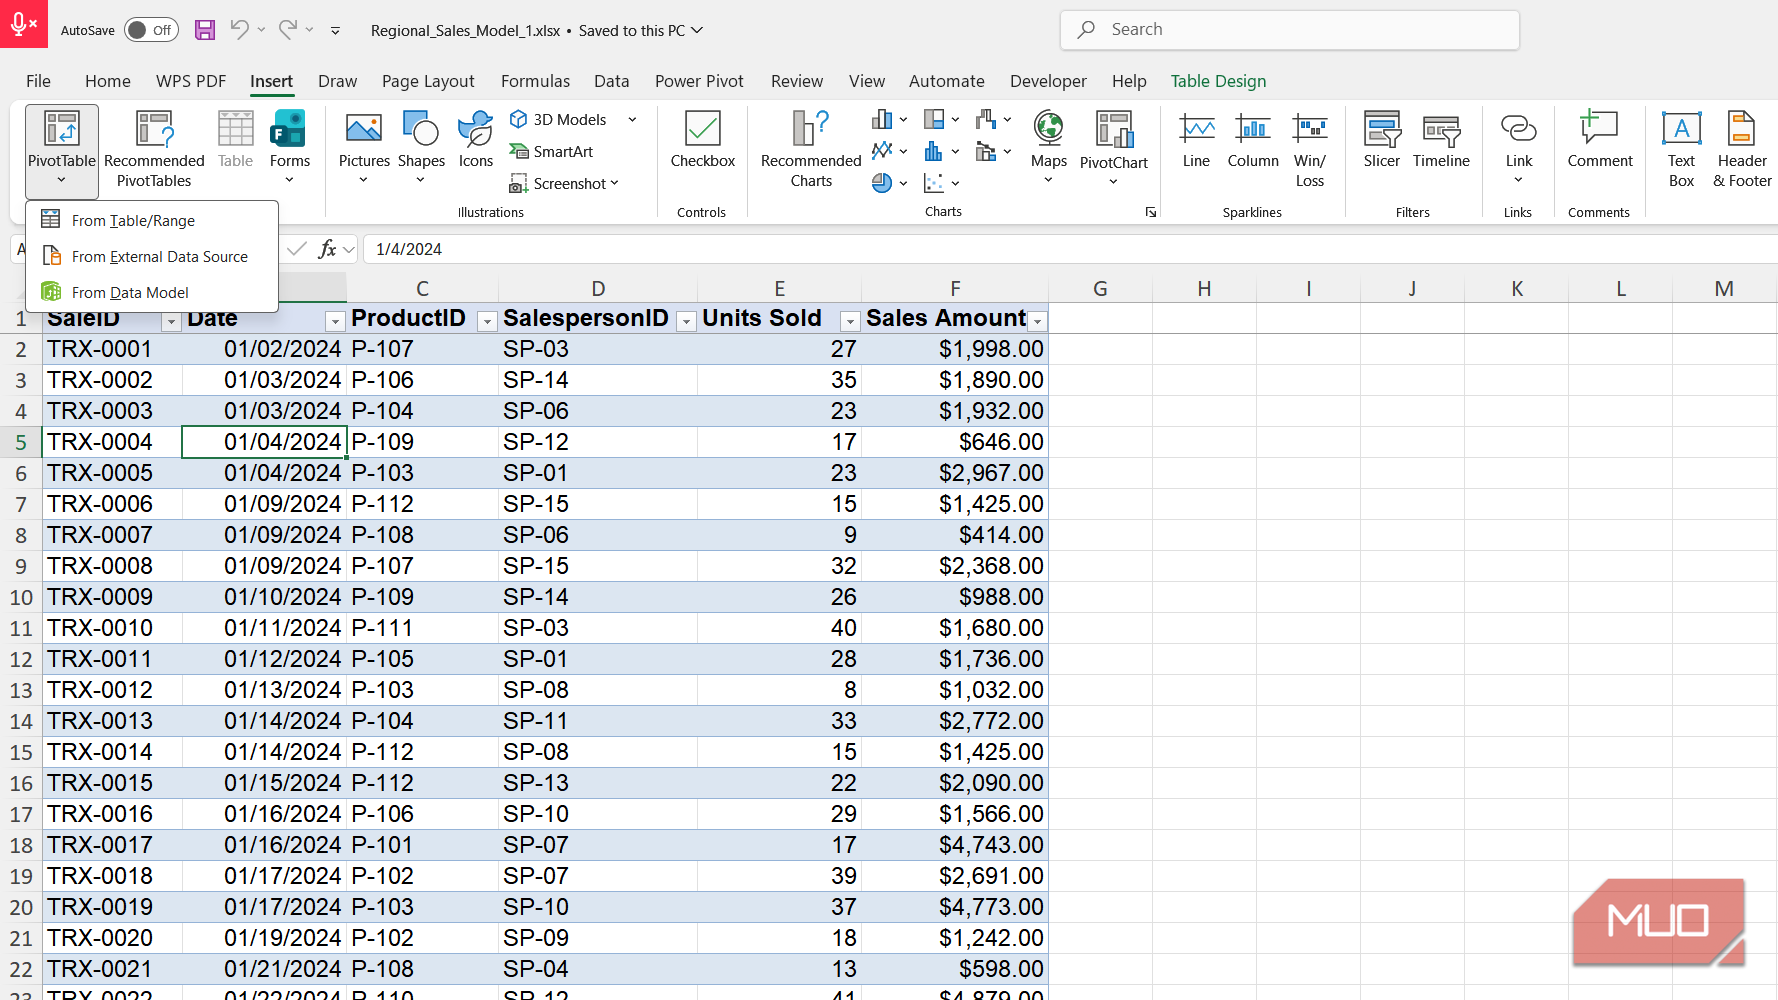
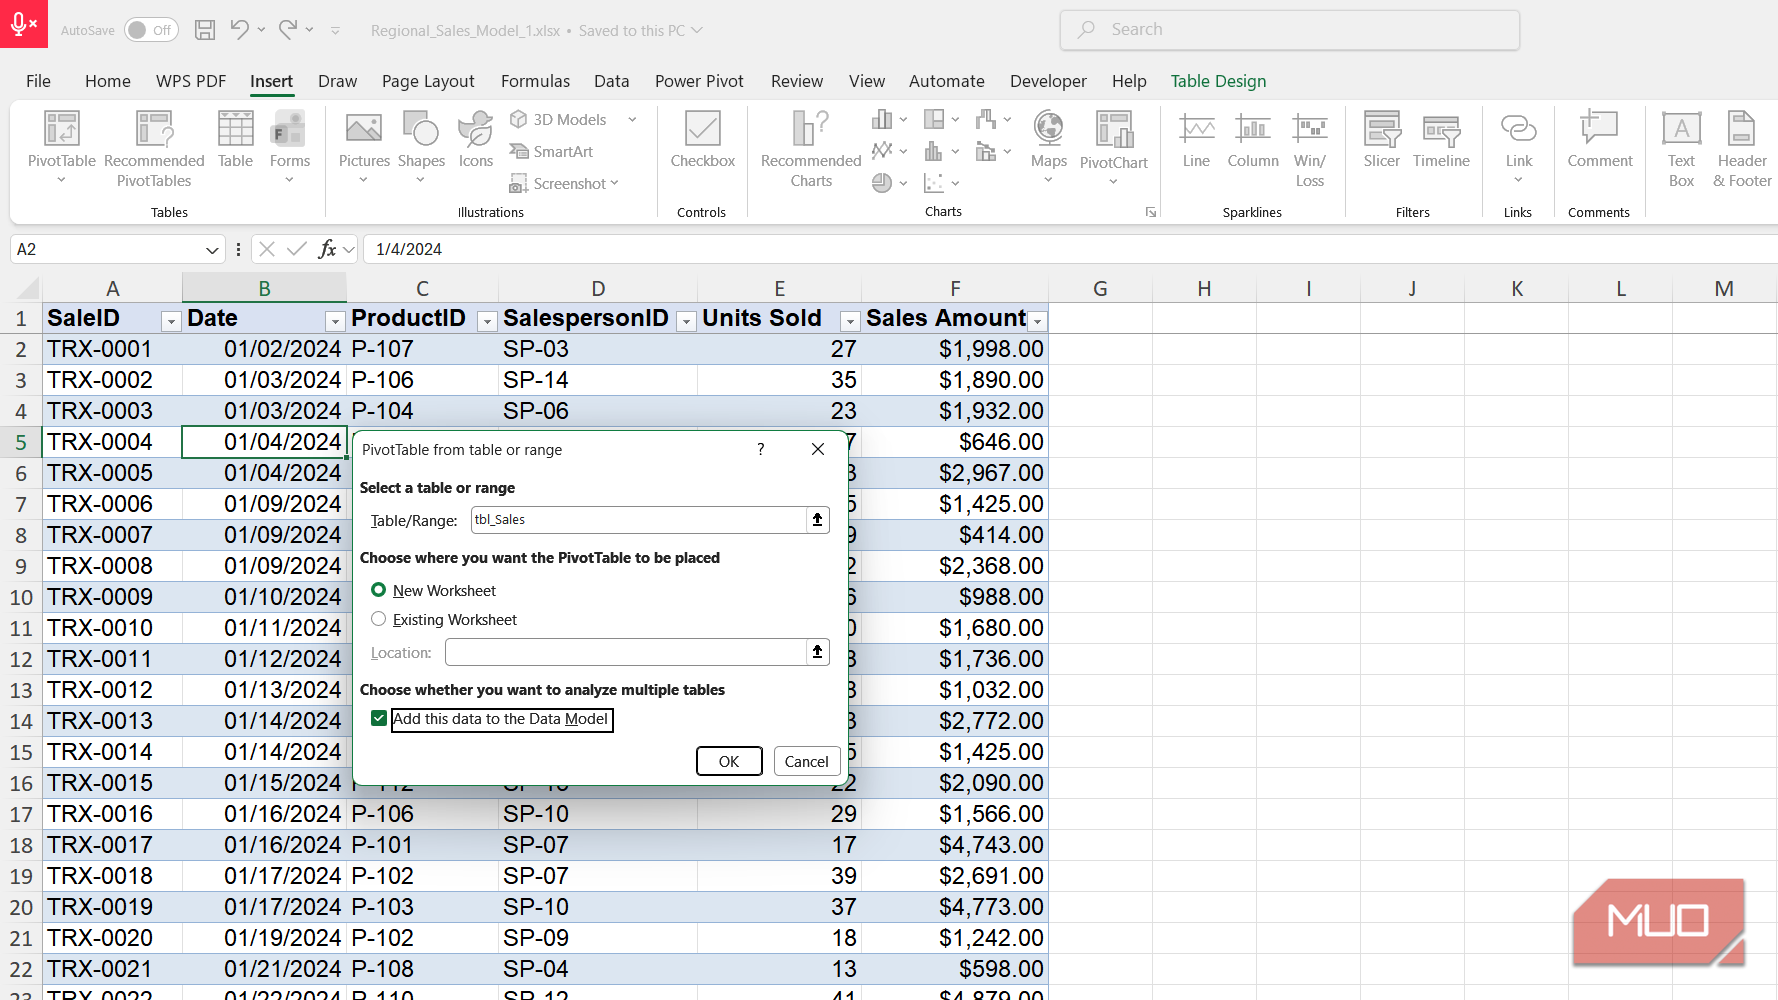
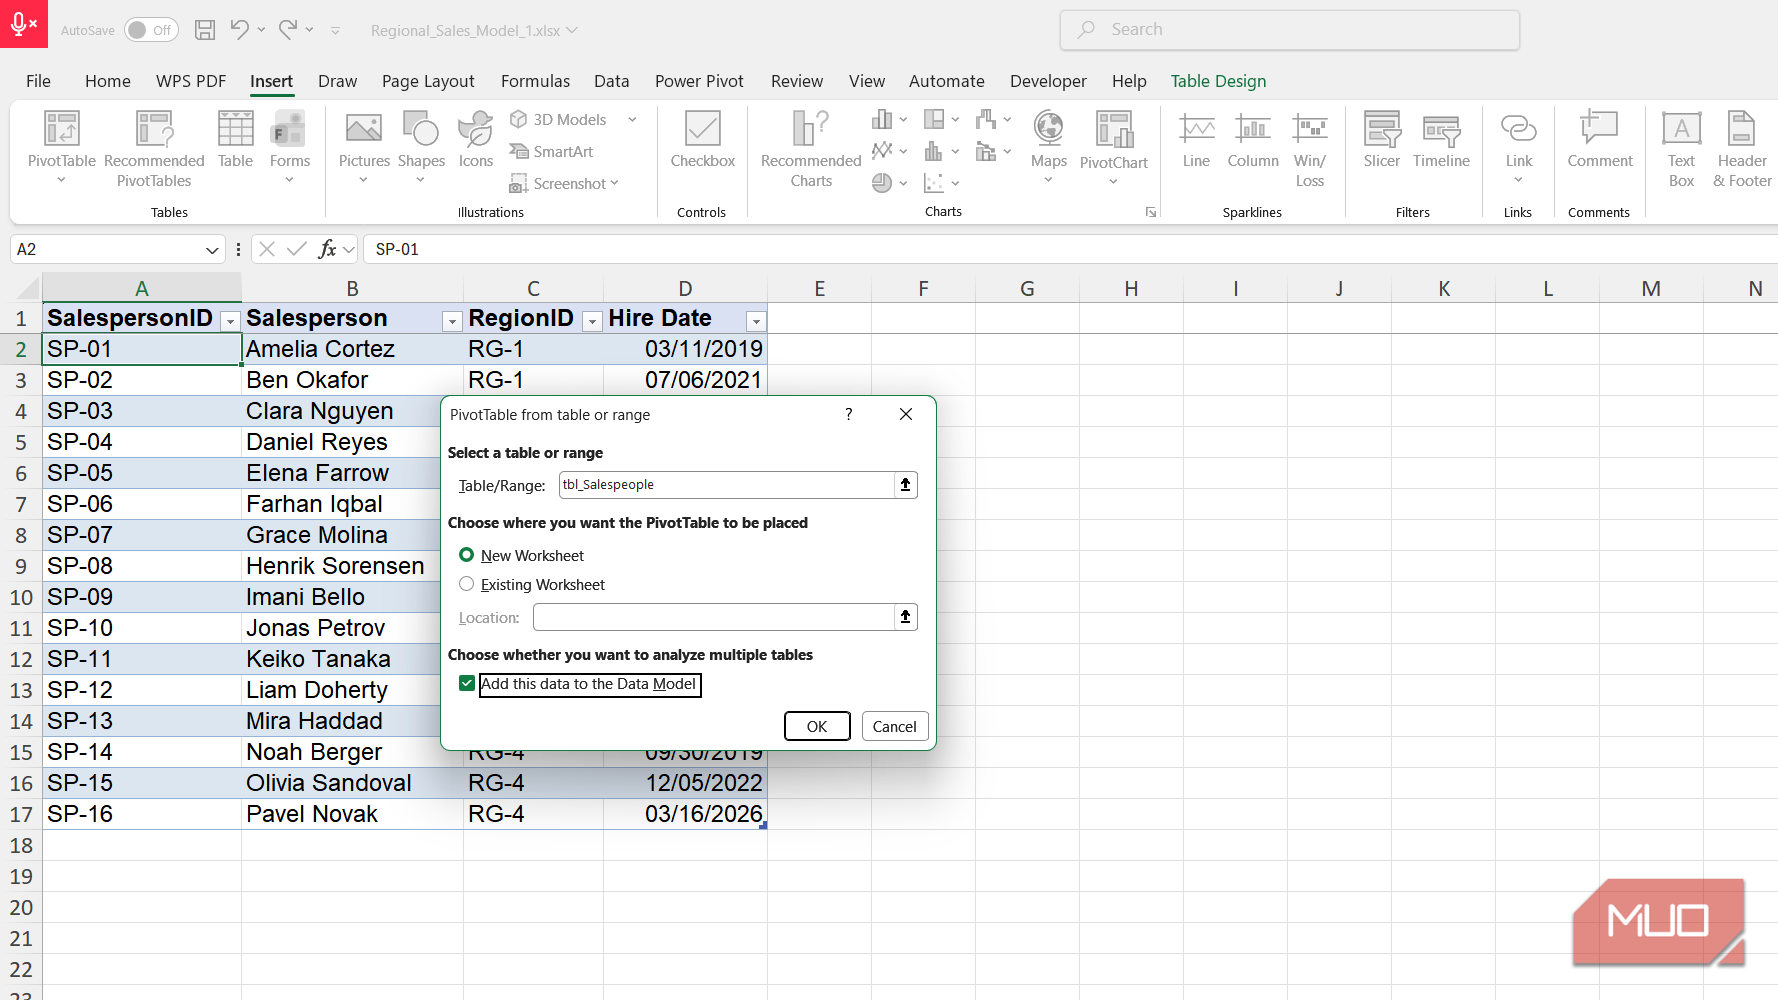
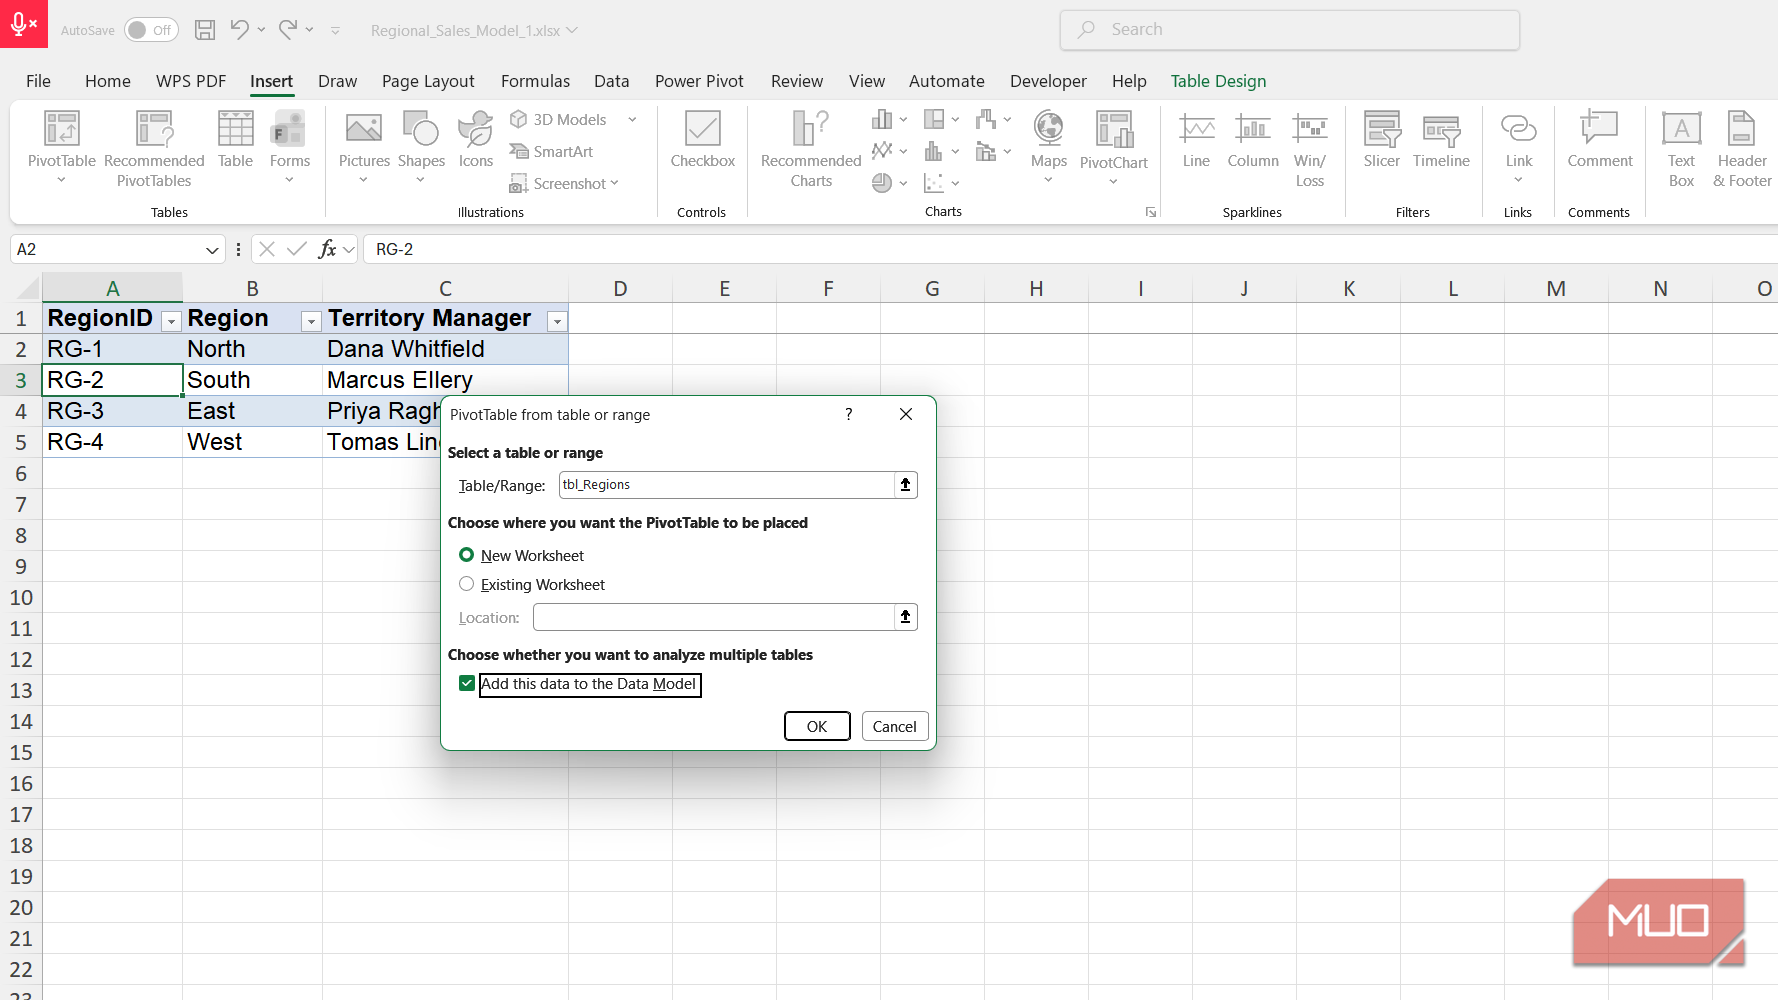
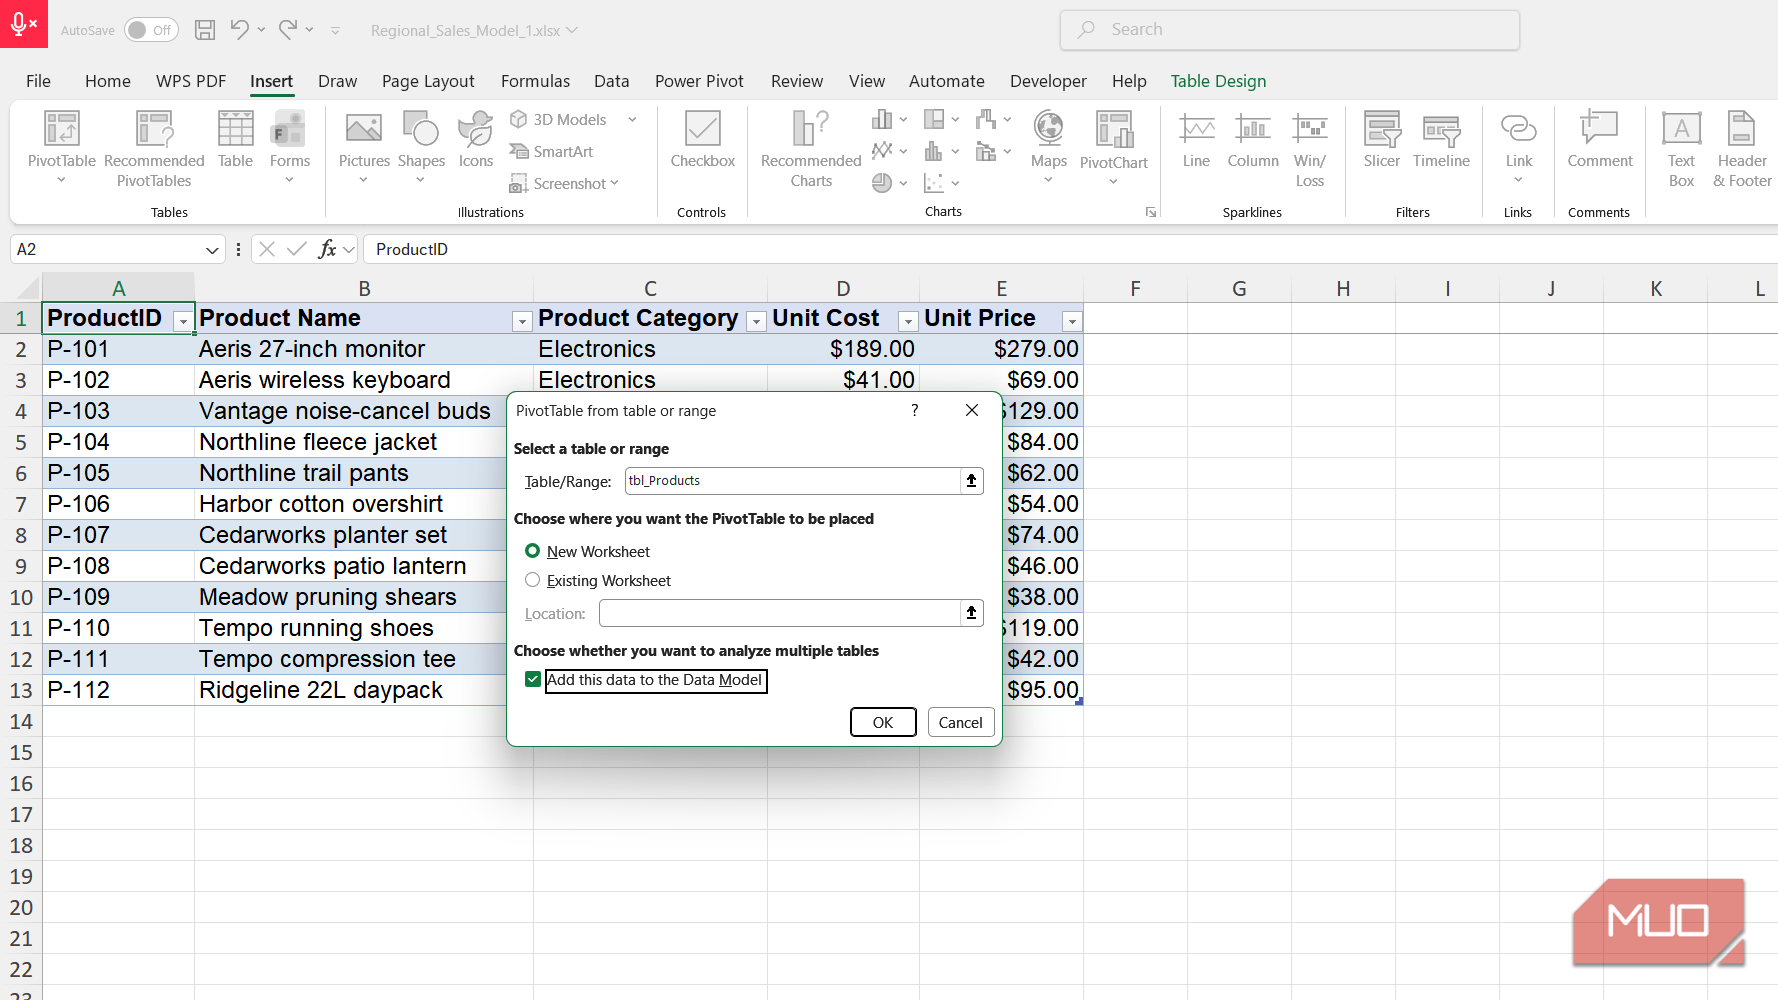
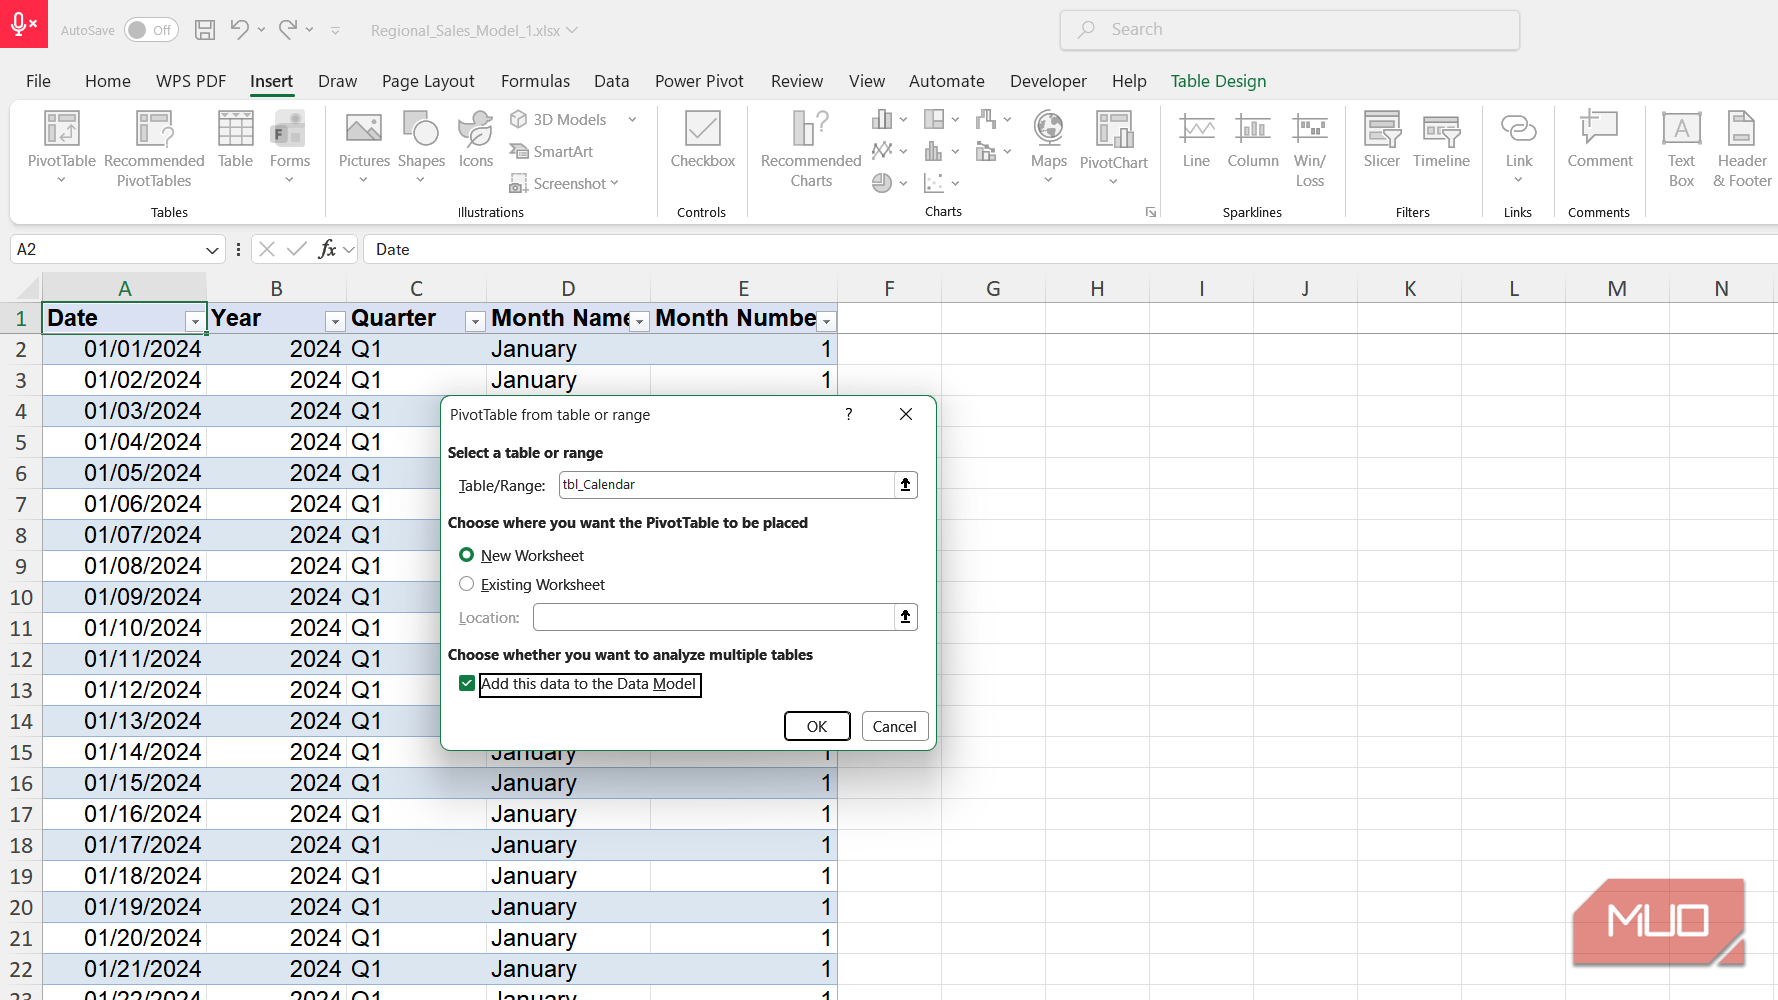
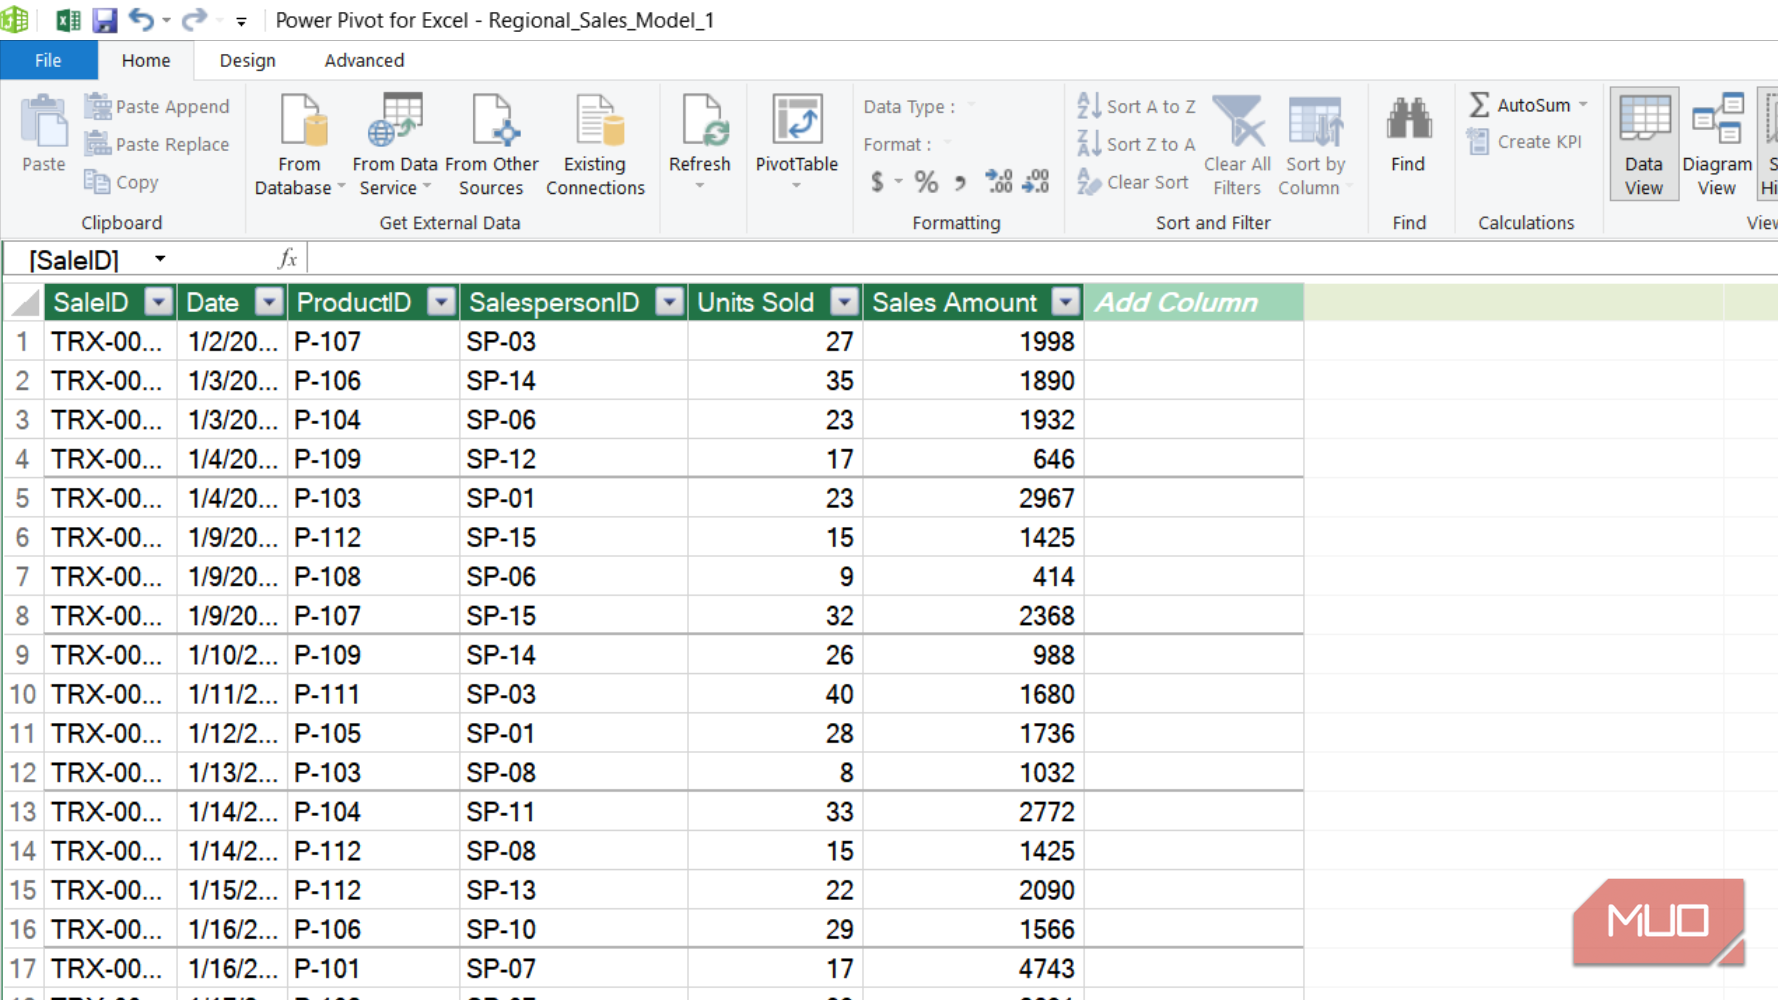
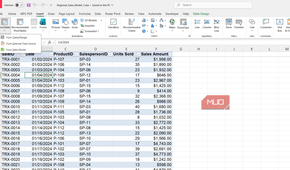
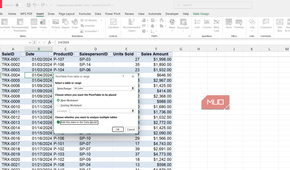
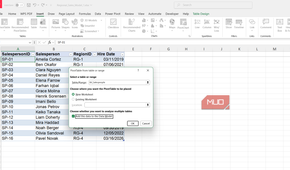
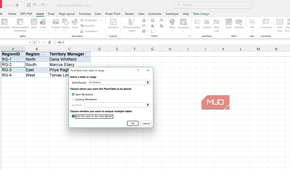
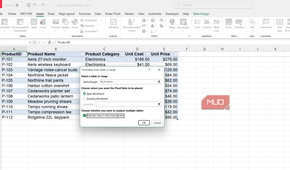
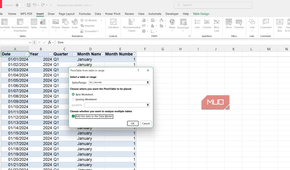
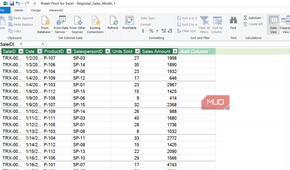
Getting a table into the model takes one checkbox. When you insert a PivotTable, tick Add this data to the Data Model in the Create PivotTable dialog, and Excel builds the model around it. If the table already sits on a sheet, Power Pivot > Add to Data Model does the same job. Importing several tables at once through Get & Transform builds a model without asking you at all.
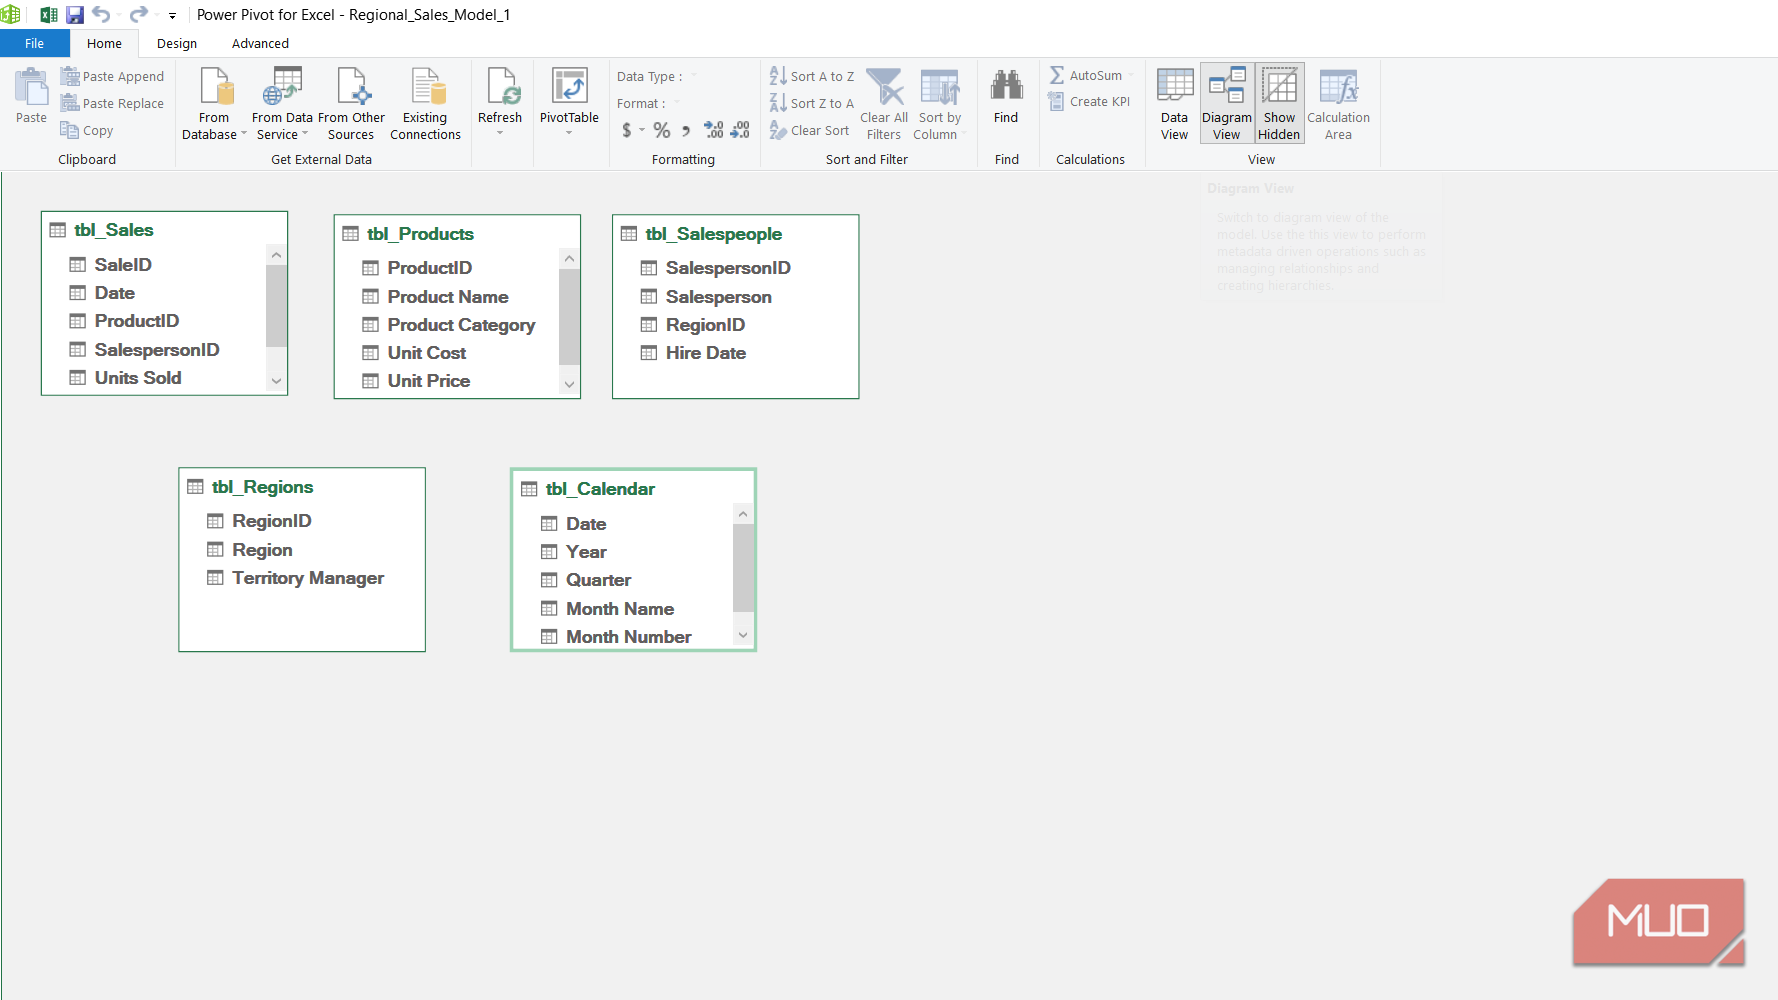
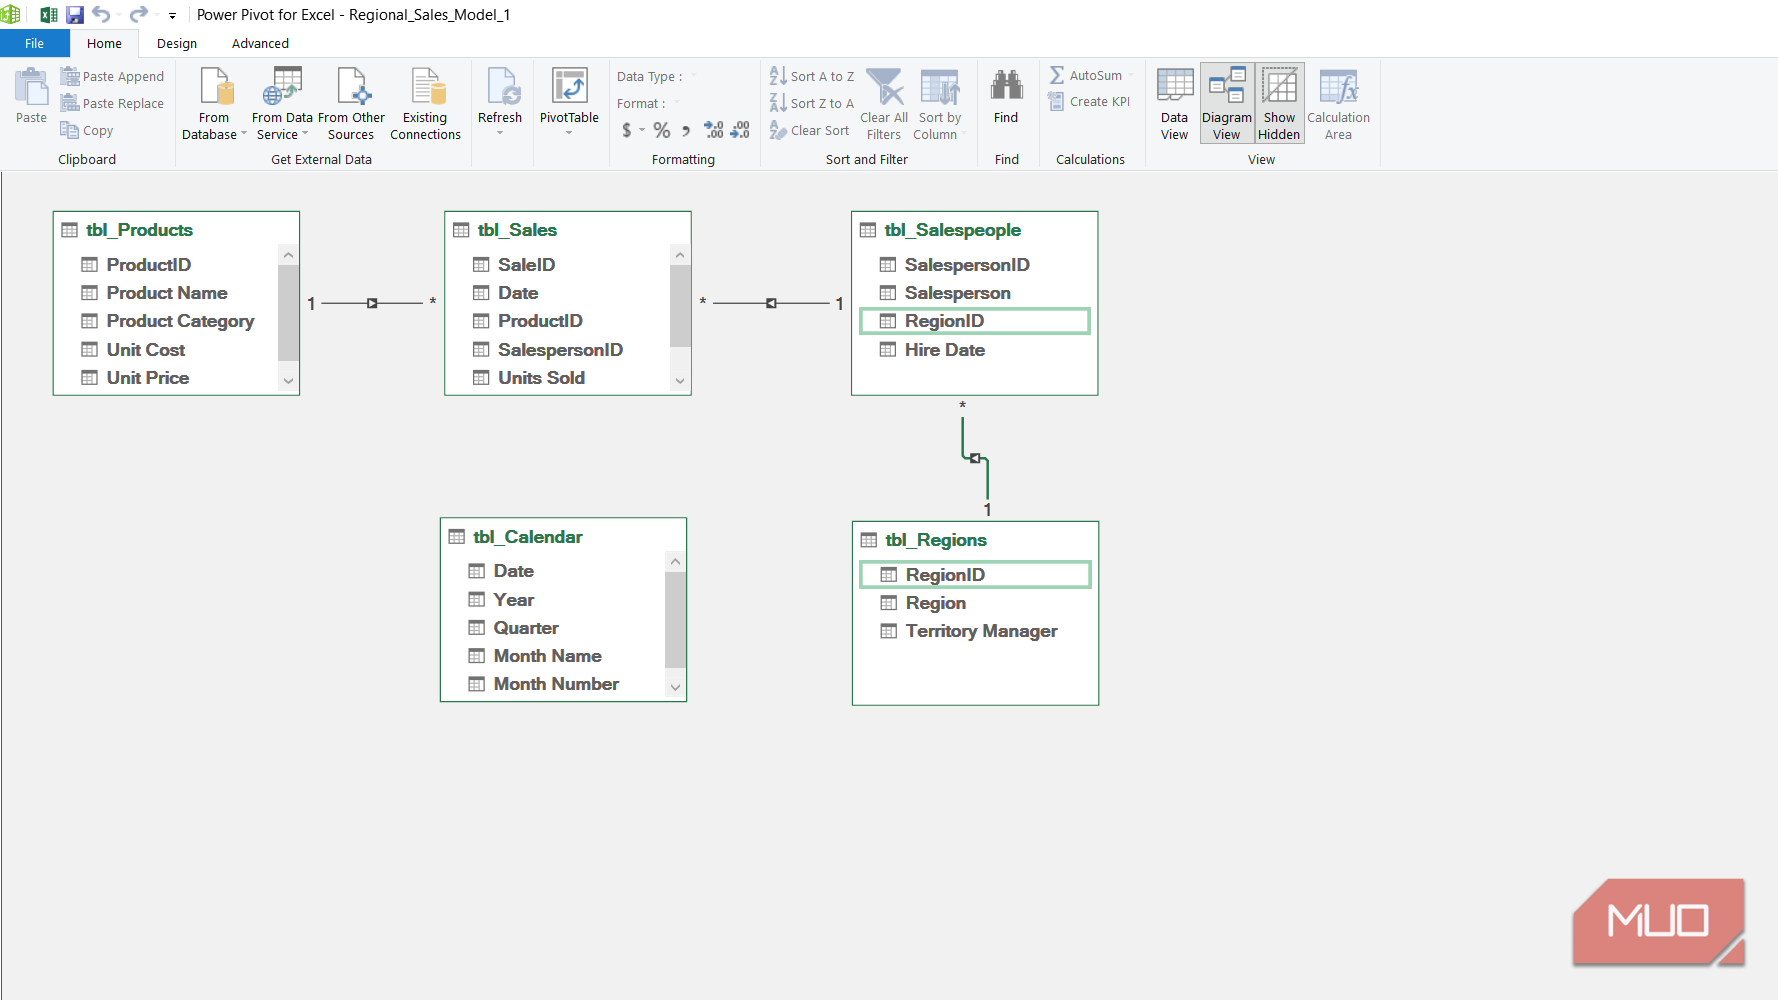
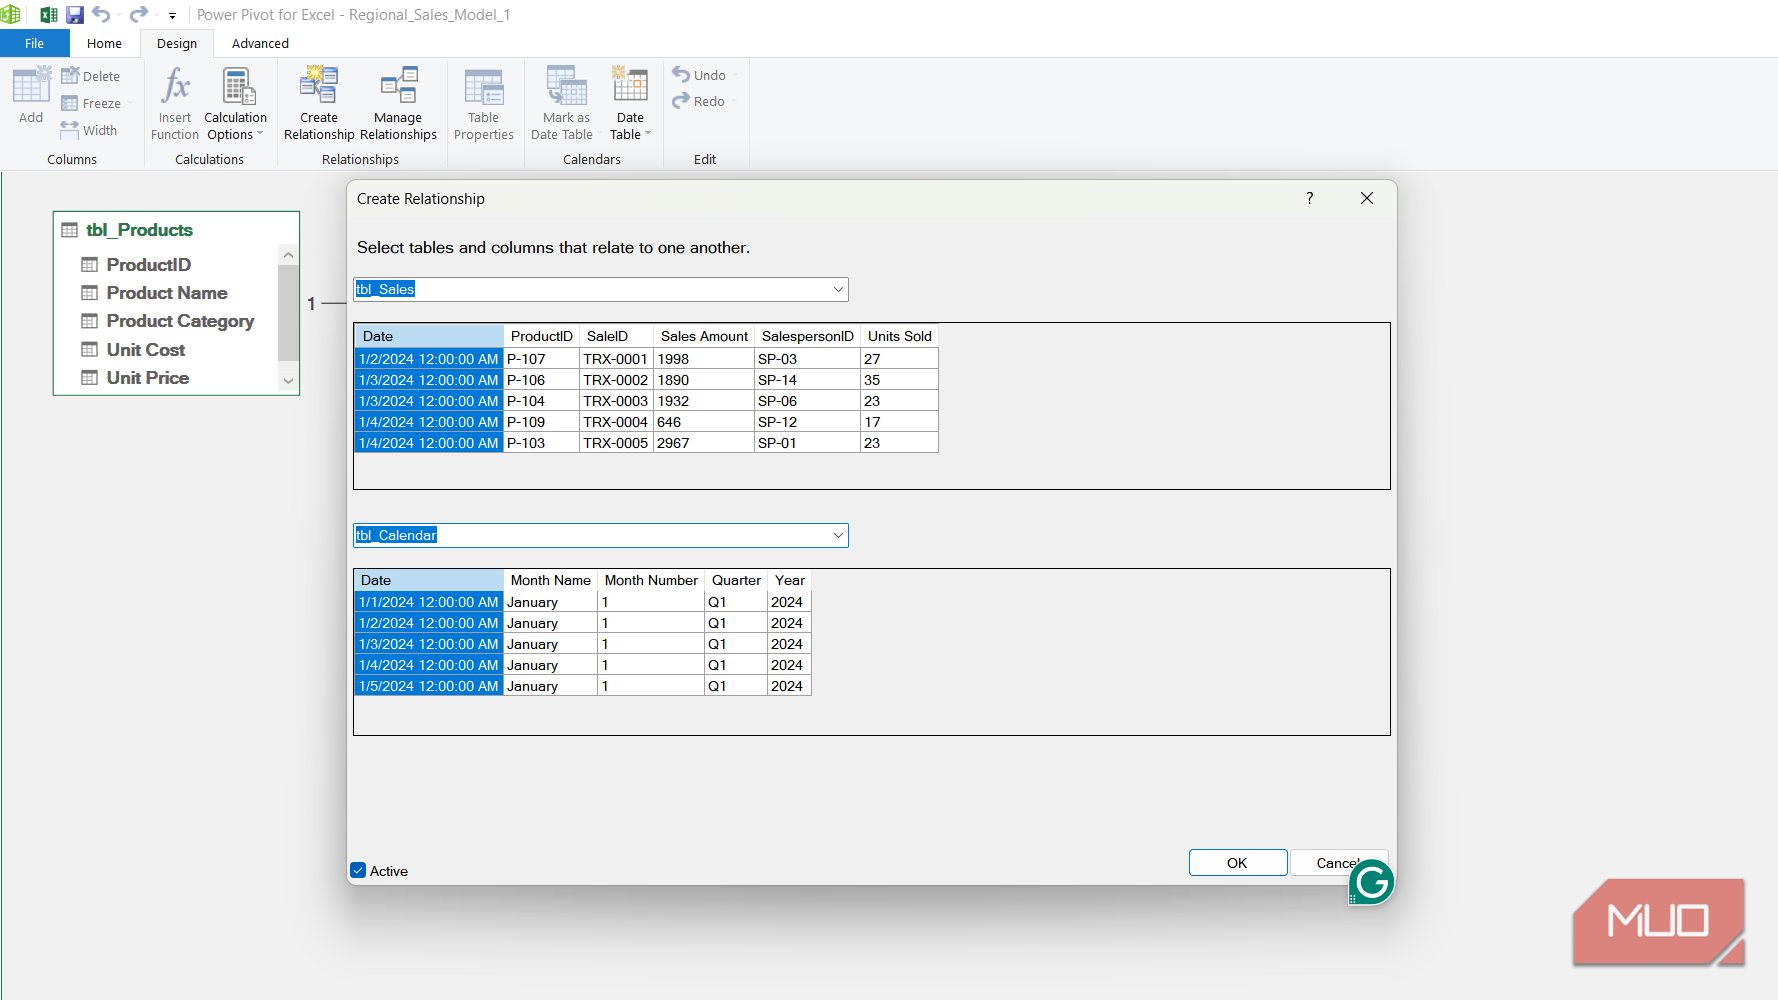
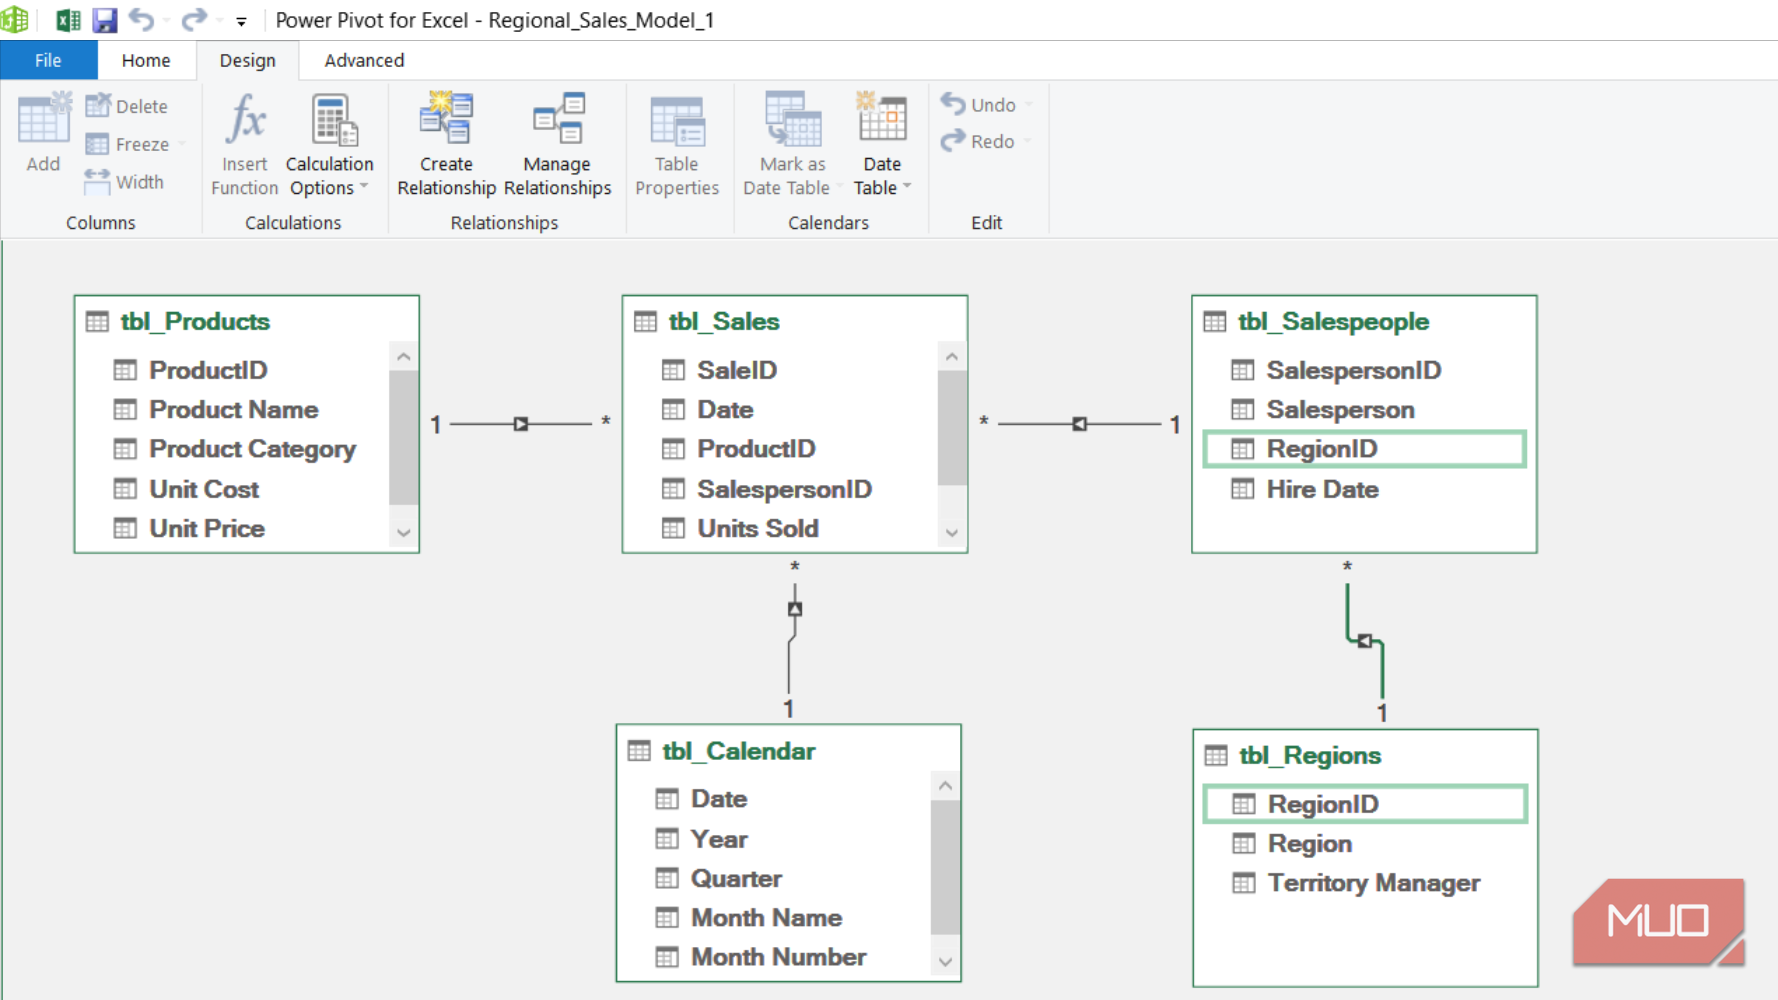
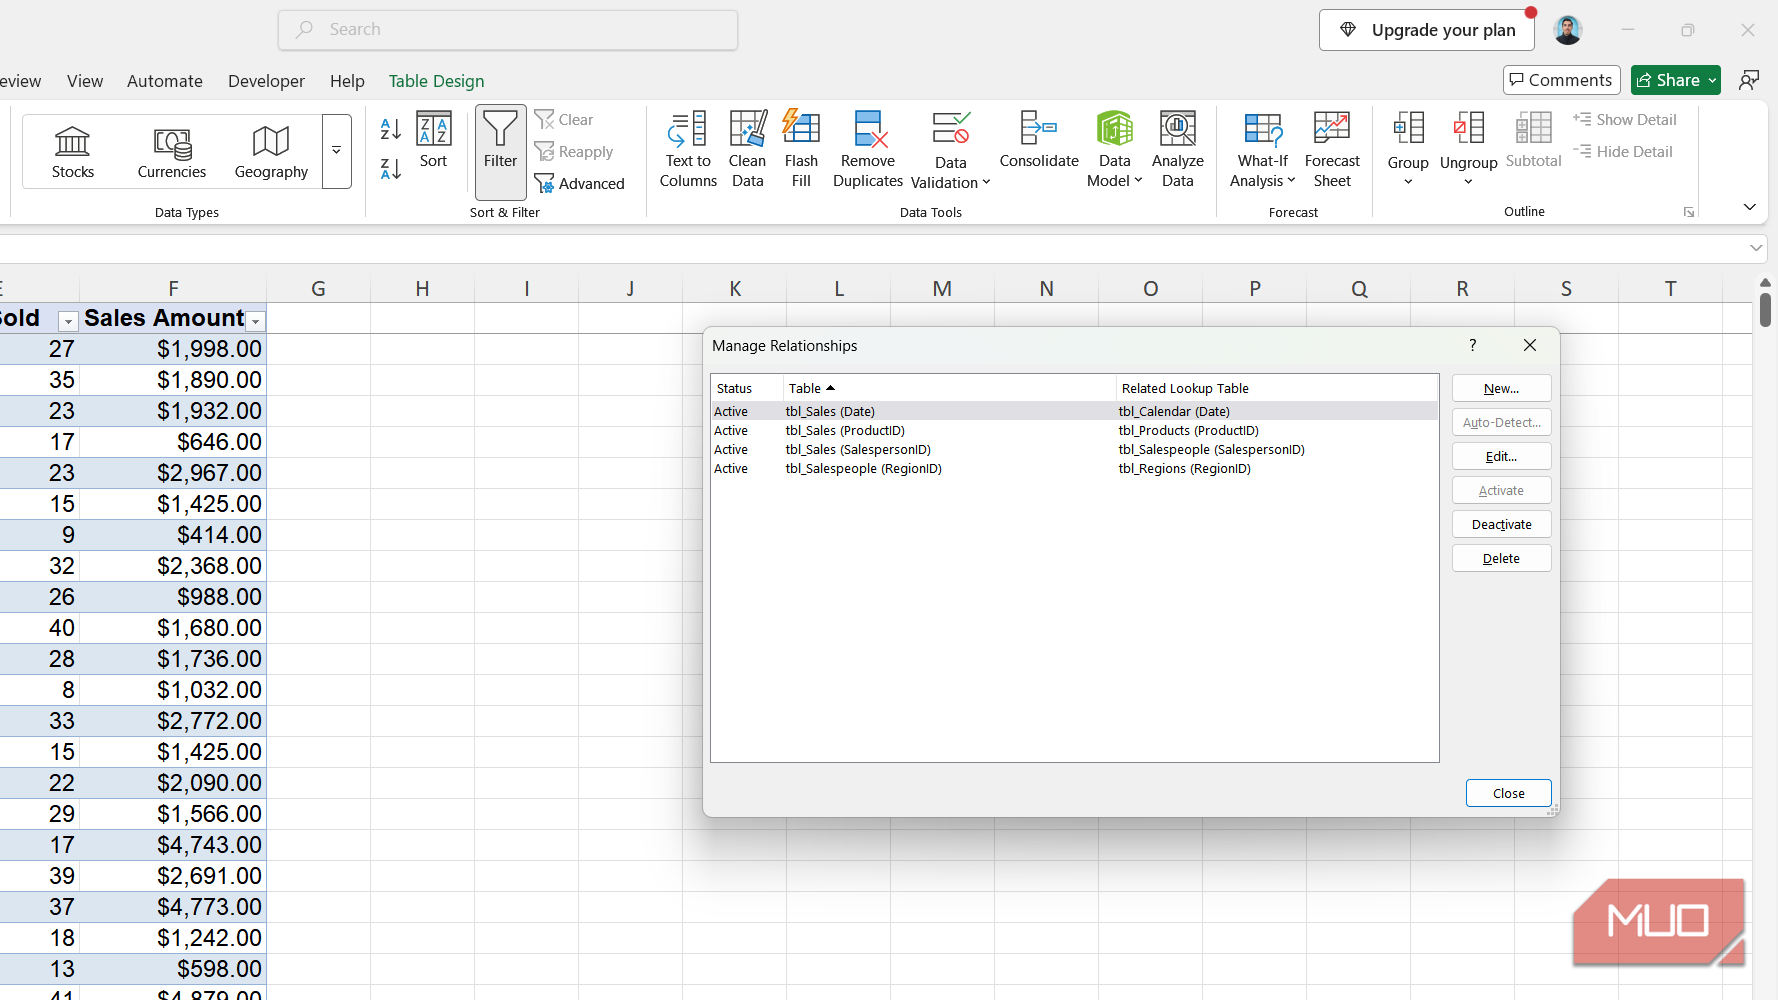
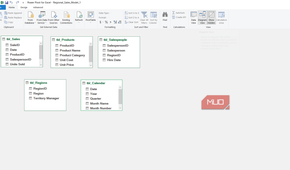
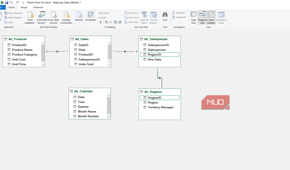
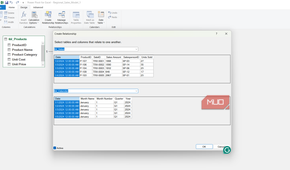
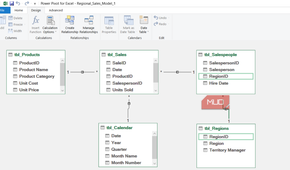
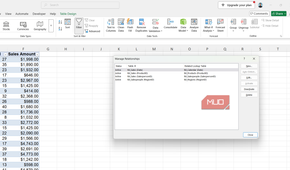
Relationships get built in Power Pivot > Manage > Diagram View, where each table appears as a box you can drag around. Data > Relationships does the same work without leaving the grid, though the diagram is far easier to read once you have more than two tables.
My workbook needs four of them. The sales table points at Products through ProductID and at Salespeople through SalespersonID. Salespeople point at Regions through RegionID, and every transaction date points at the Calendar table. Field names don't have to match on both sides, but the data types do, which is where most first attempts quietly fail.
Each connector shows a 1 on one side and an asterisk on the other. That is the one-to-many direction, and it decides how figures roll up, so a region with several salespeople totals their transactions instead of repeating itself. A lookup column costs one formula for every attribute you want, recalculates on every edit, and needs dragging down again whenever new rows land. A relationship is defined once and then forgotten about.
None of this is enforced the way a foreign key is. A relationship tells Excel how tables connect, but nothing stops a bad SalespersonID arriving from the source, and past a certain size a spreadsheet buckles as a system of record. Most workbooks sit nowhere near that line, and the model asks for nothing you have to install or get approved.
One PivotTable can read every table
The Field List stops being a single-sheet menu


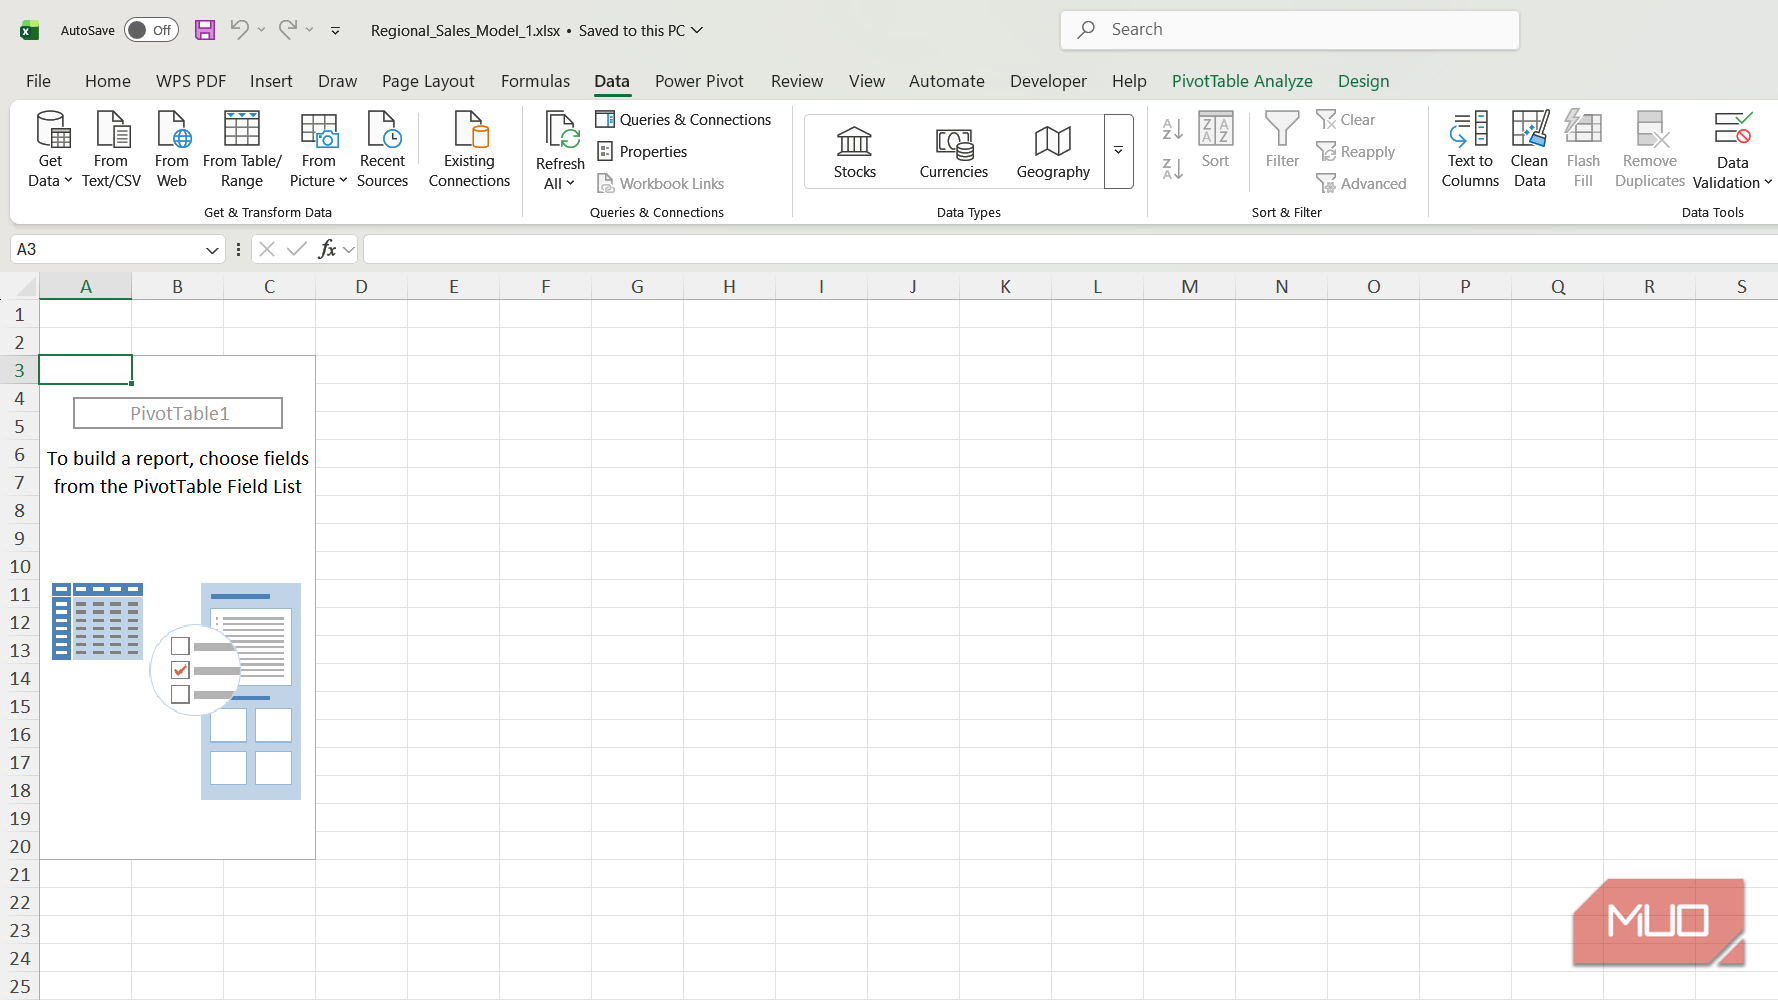
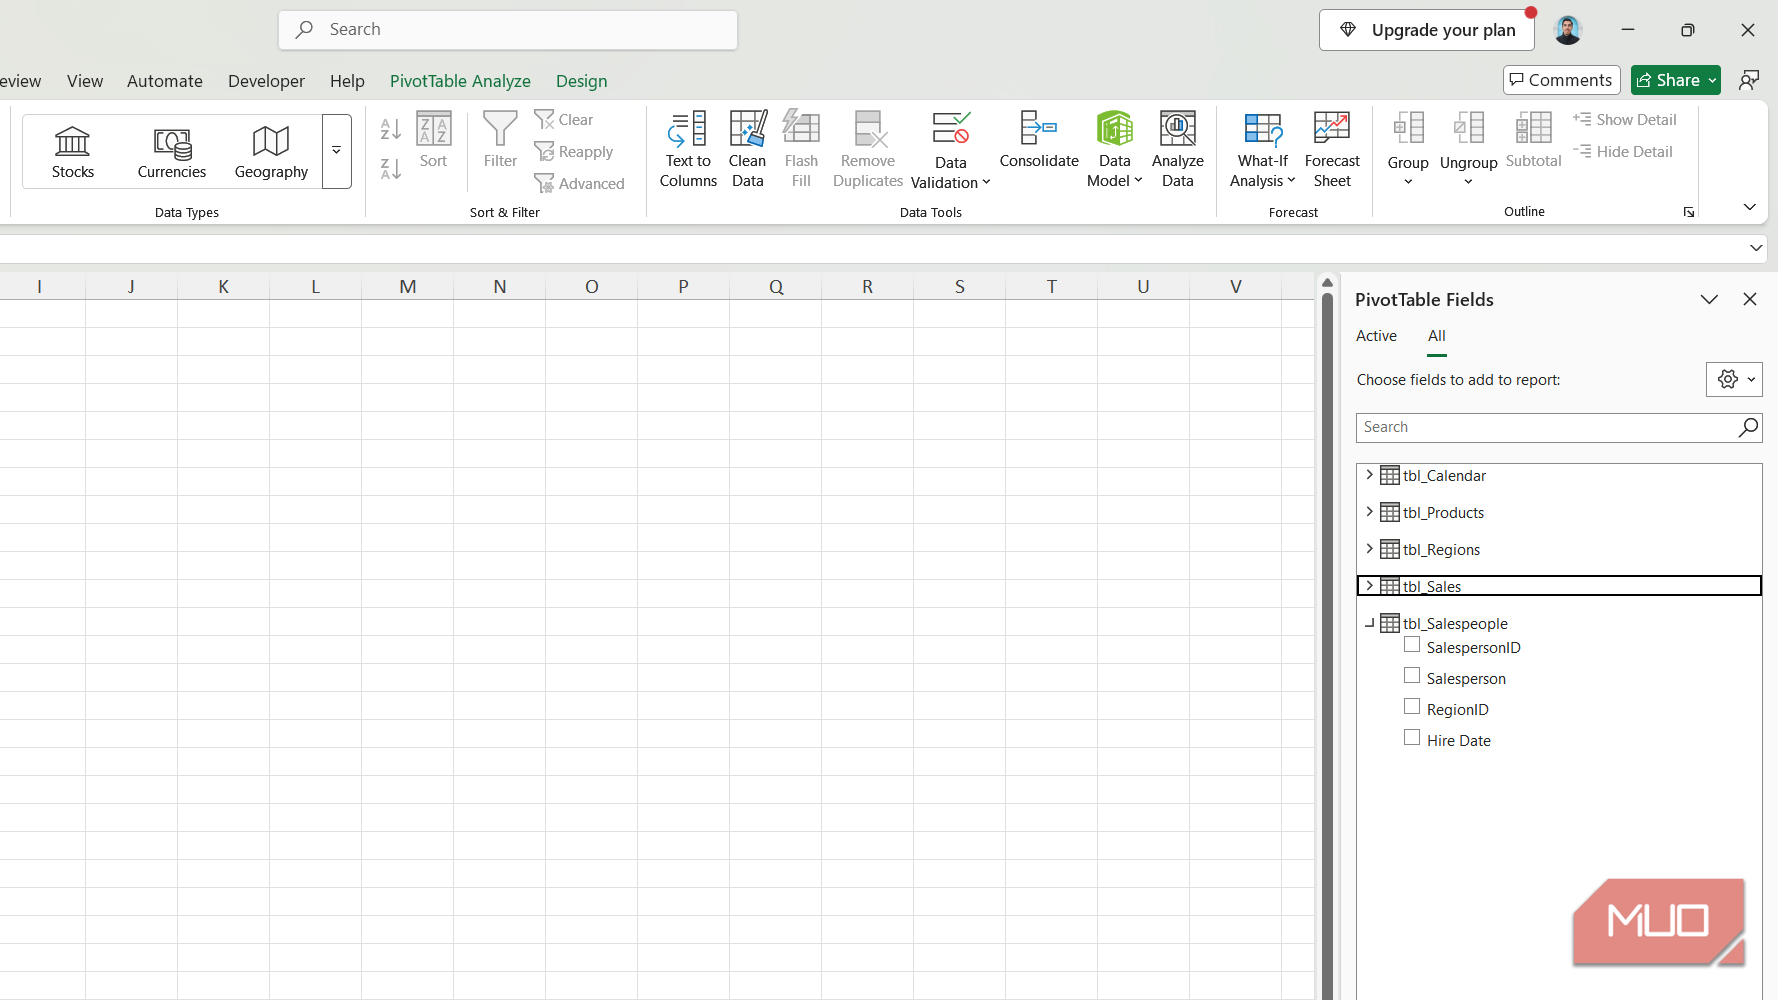
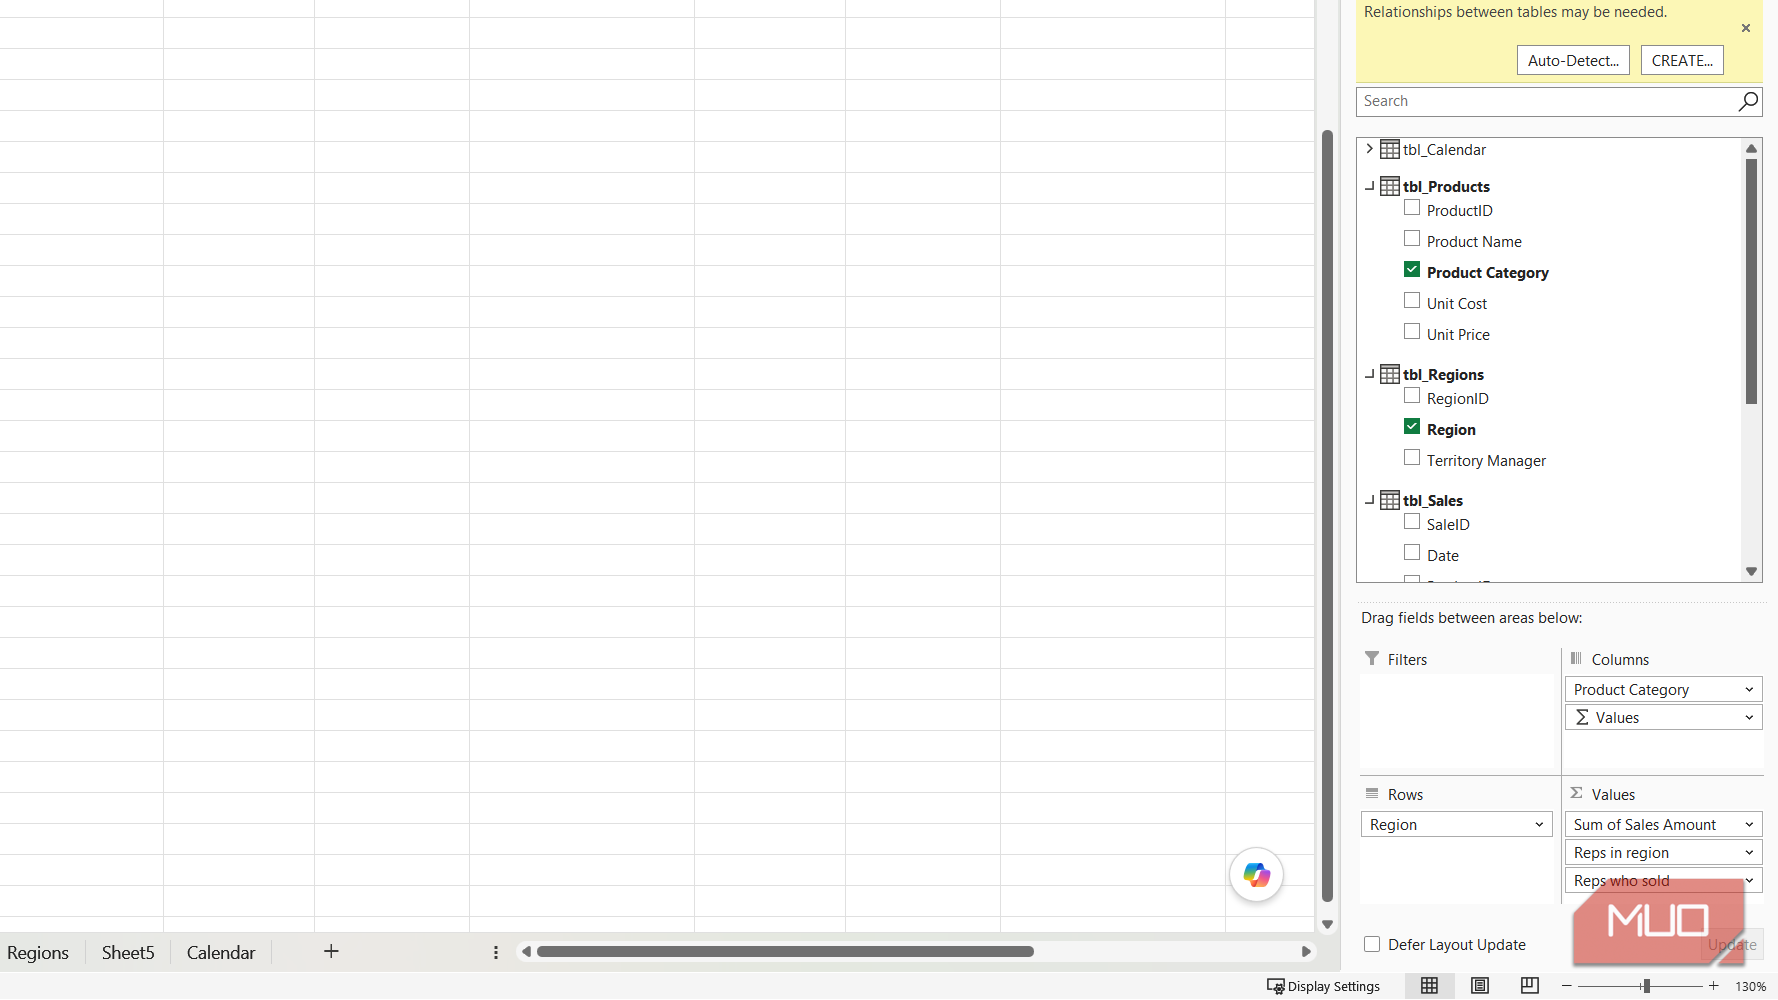
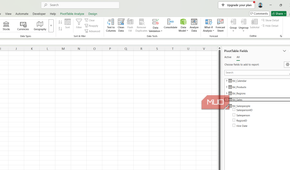
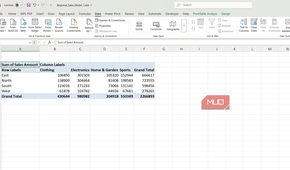
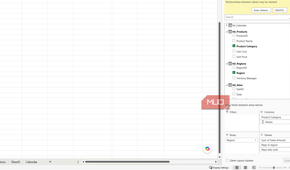
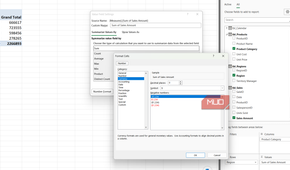
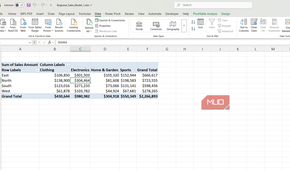
Build a PivotTable on the model and the Field List shows every table in it rather than the single sheet you started from. Fields from any of them drop into the same report.
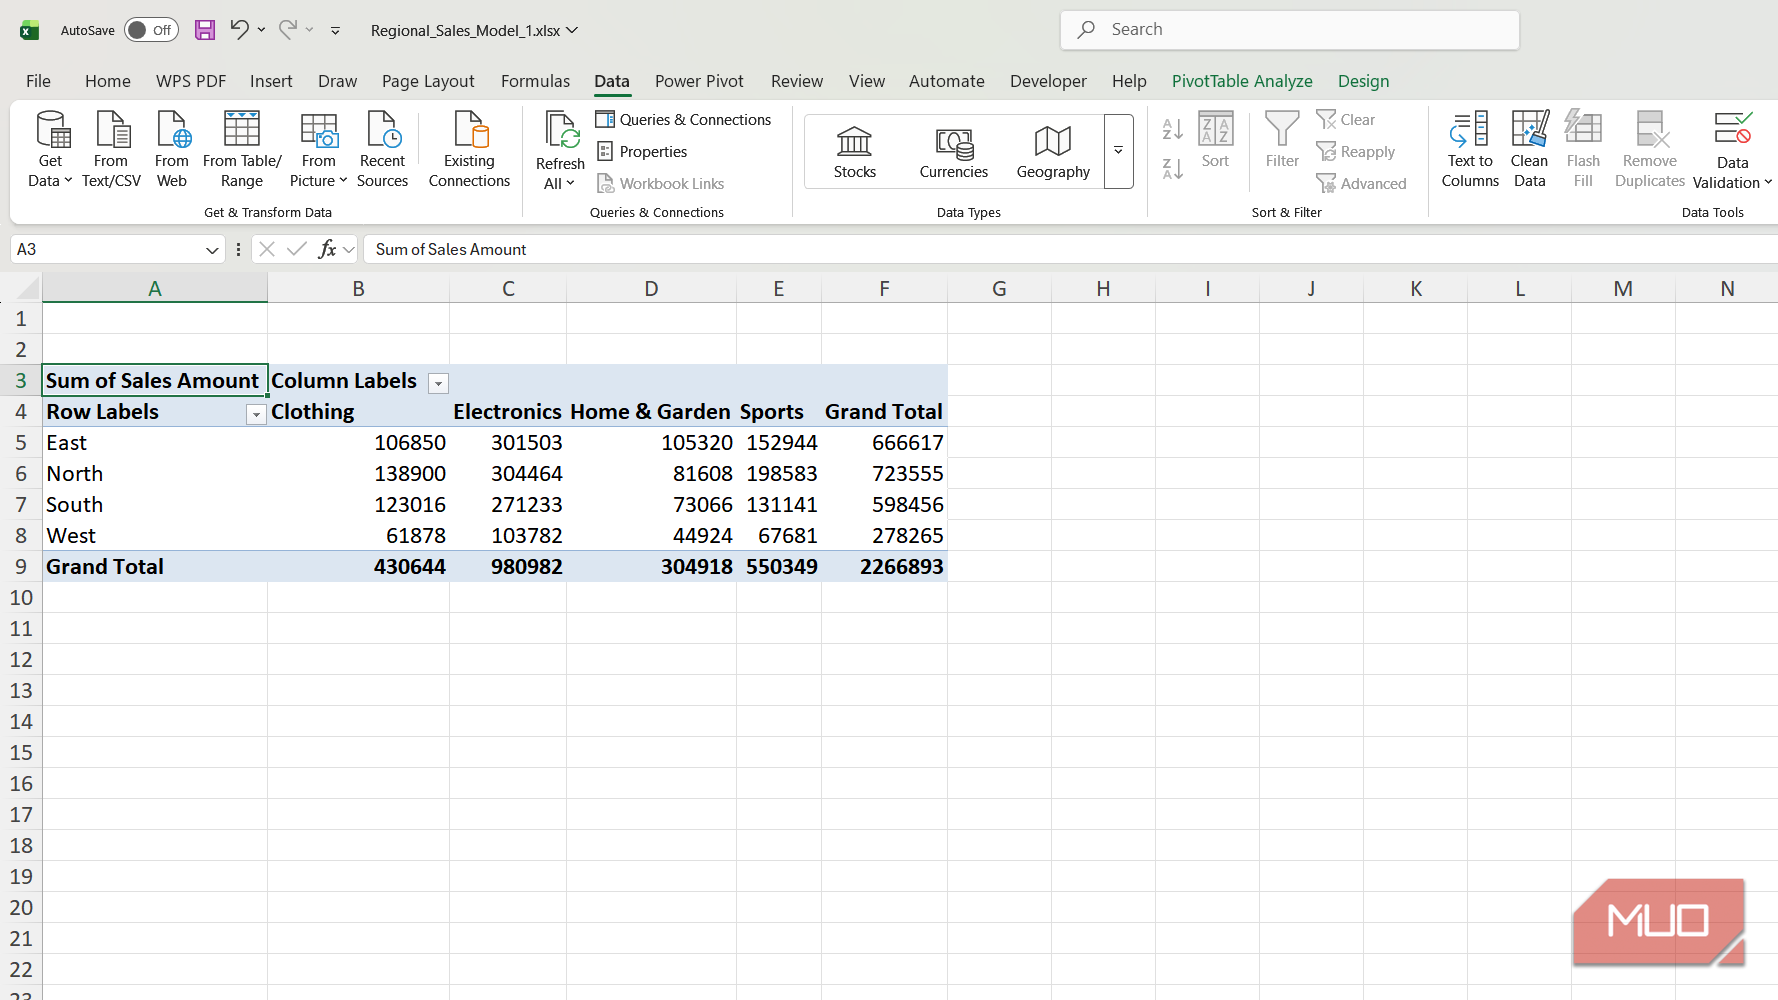
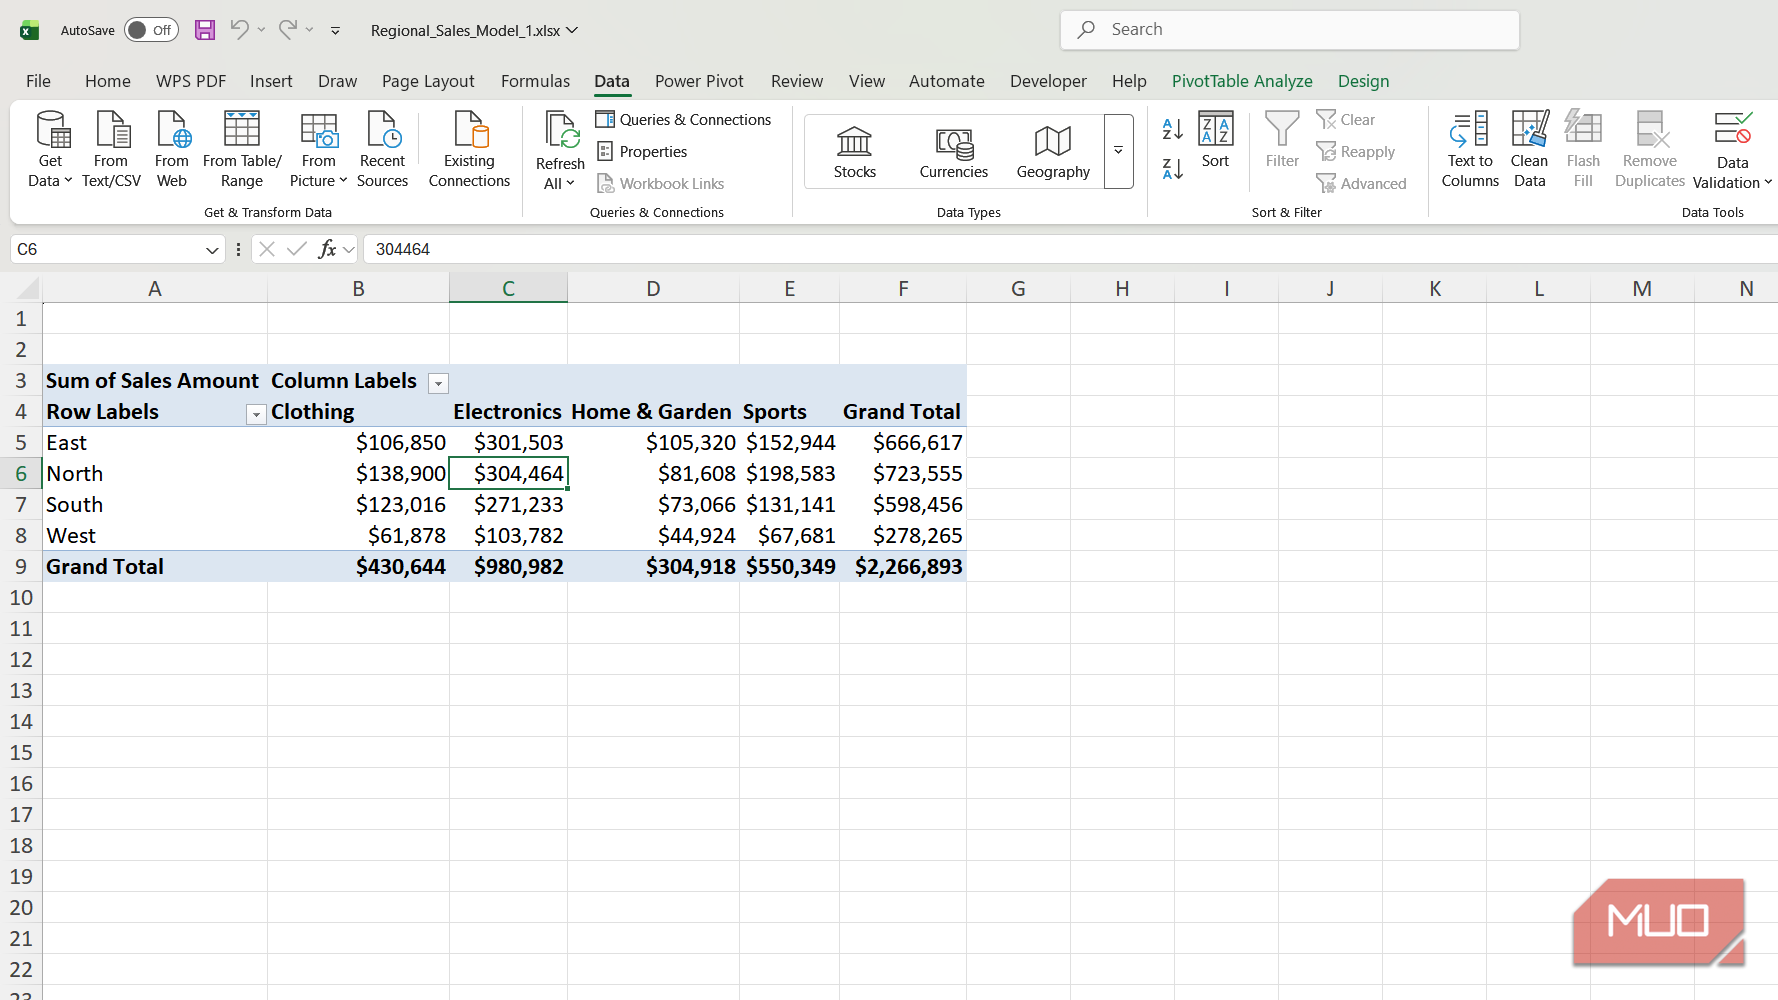
I put Region on Rows, Product Category on Columns, and Sales Amount in Values. Three fields, three different sheets, one report. North came out at $723,555, South at $598,456, East at $666,617, and West trailing well behind at $278,265 across 1,000 transactions. Electronics carries $980,982 of the $2,266,893 total, and North's Electronics cell alone reads $304,464. I wrote no formulas to get any of that, and there is no consolidated sheet hiding behind it.
Region is the part worth pausing on, because it is not stored in the sales sheet at all. It reaches those transaction rows through two relationships, first to the salesperson who made the sale and then to the region that salesperson covers. A lookup formula would have to nest one inside another to travel the same distance.
Slicers work through those relationships too, so if you link one slicer to every PivotTable on the sheet, a single click filters tables that share no columns whatsoever.
DAX measures do what worksheet formulas can't
Distinct count alone is worth the setup


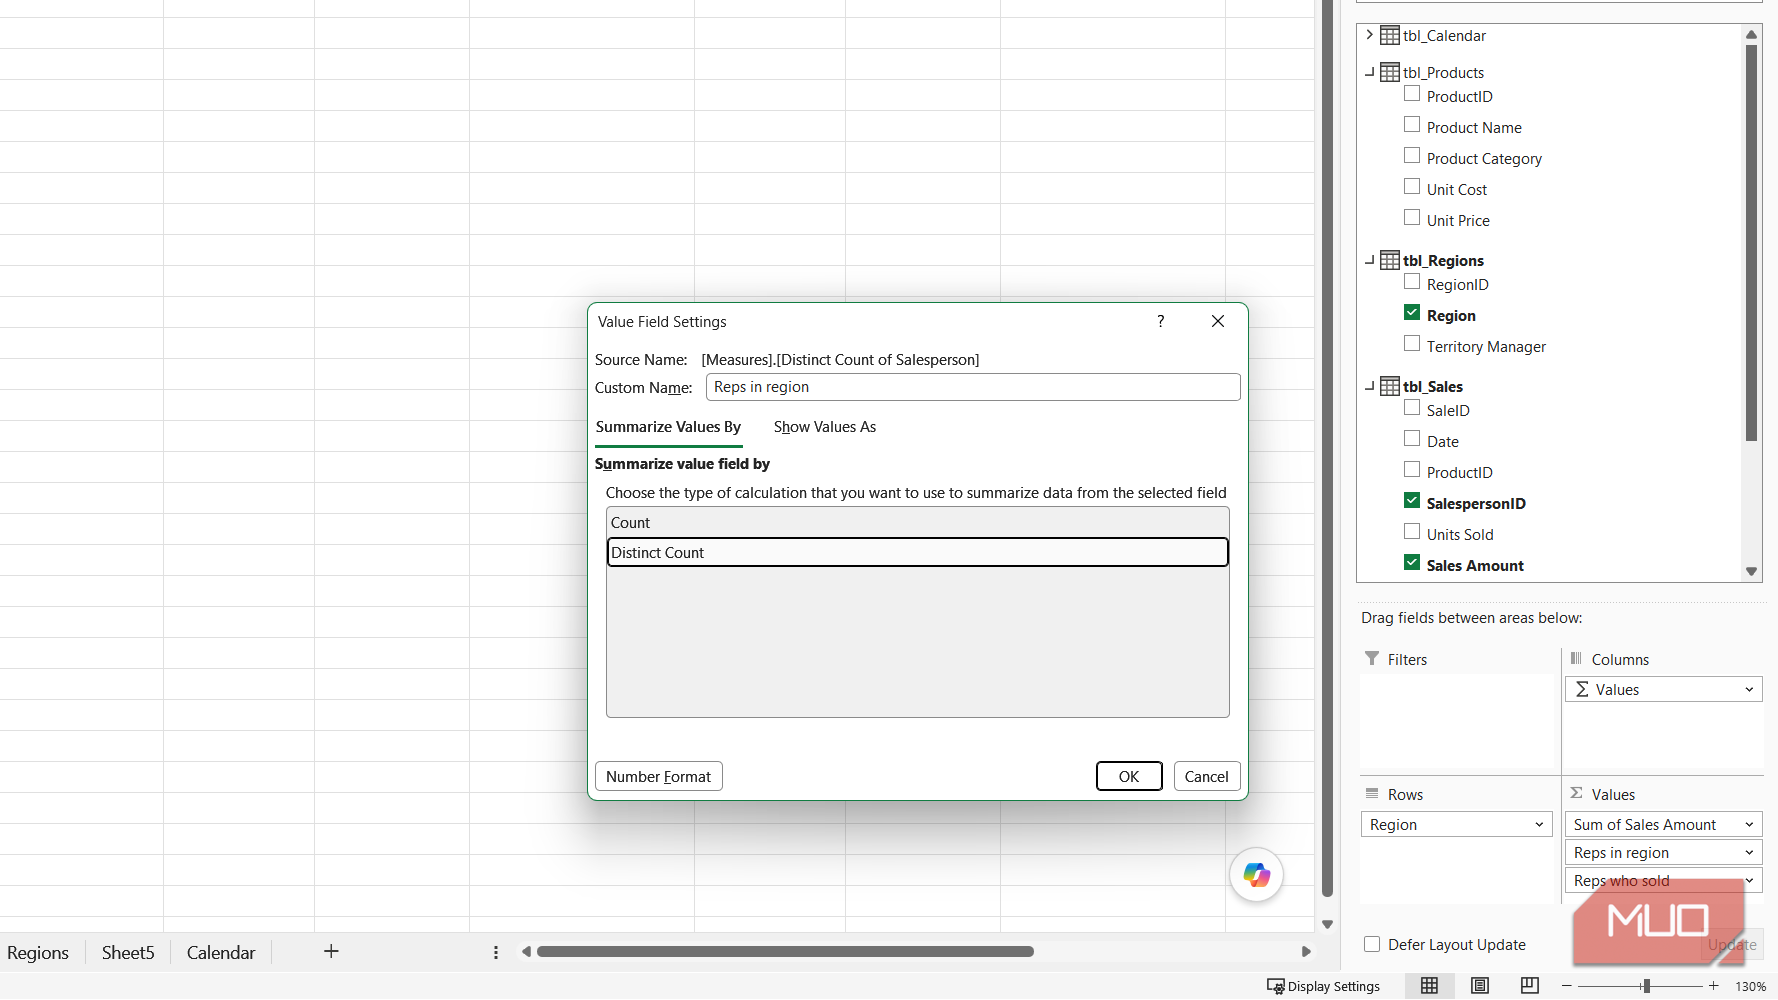
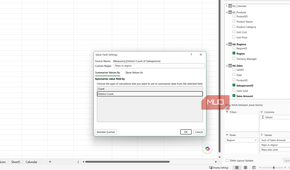
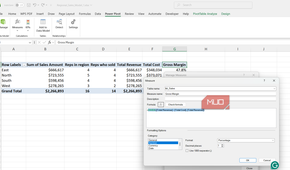
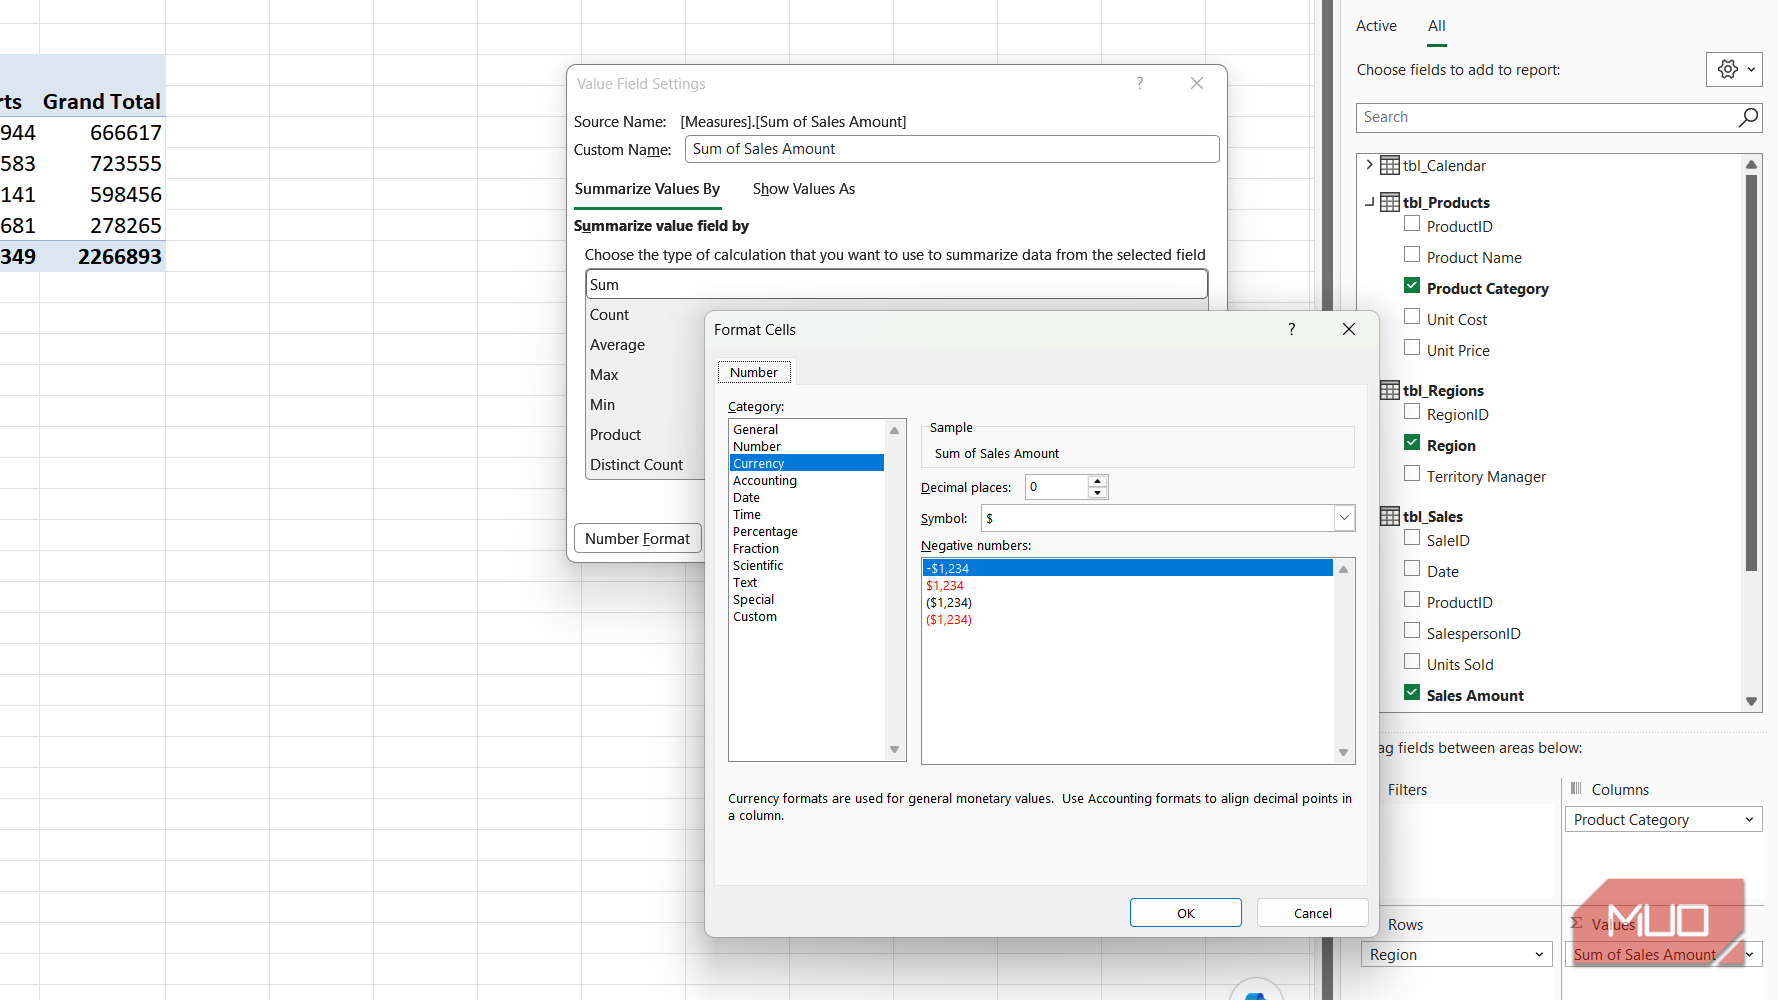
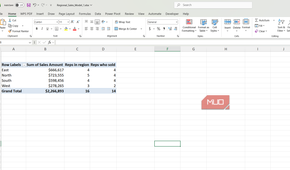
Open Value Field Settings on an ordinary PivotTable, and you won't find a distinct count option anywhere in the list. Build the same PivotTable on the Data Model and Distinct Count appears at the bottom.
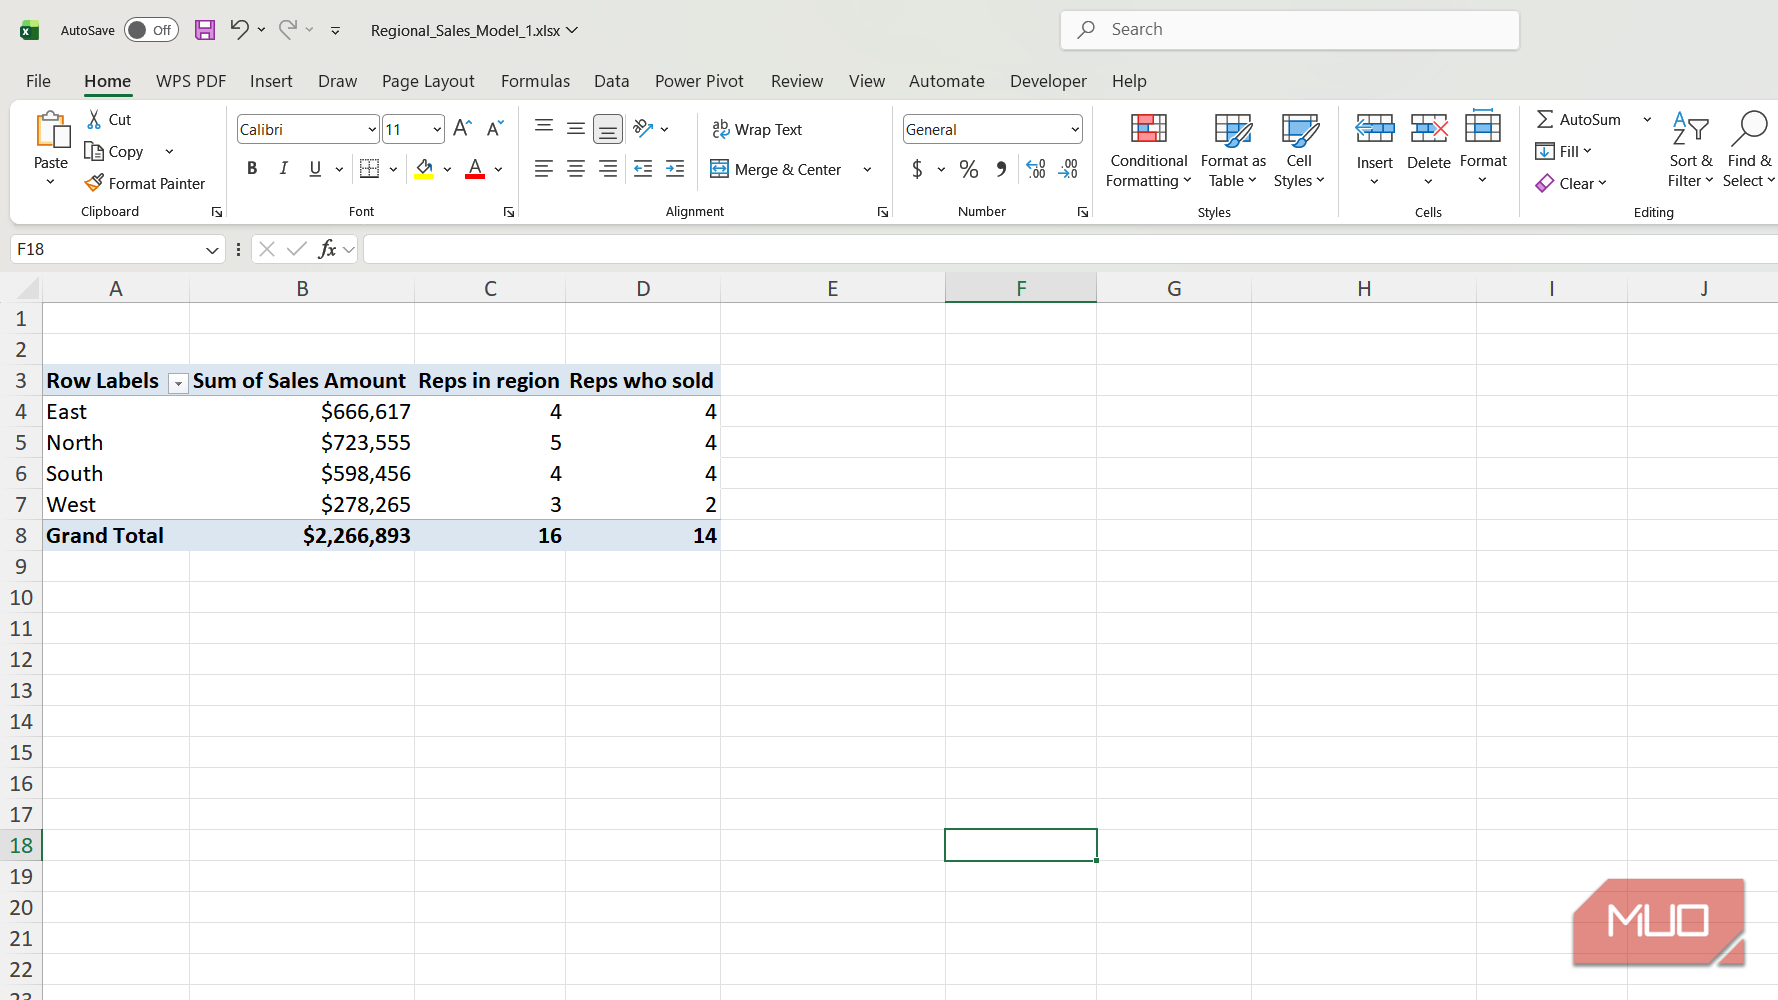
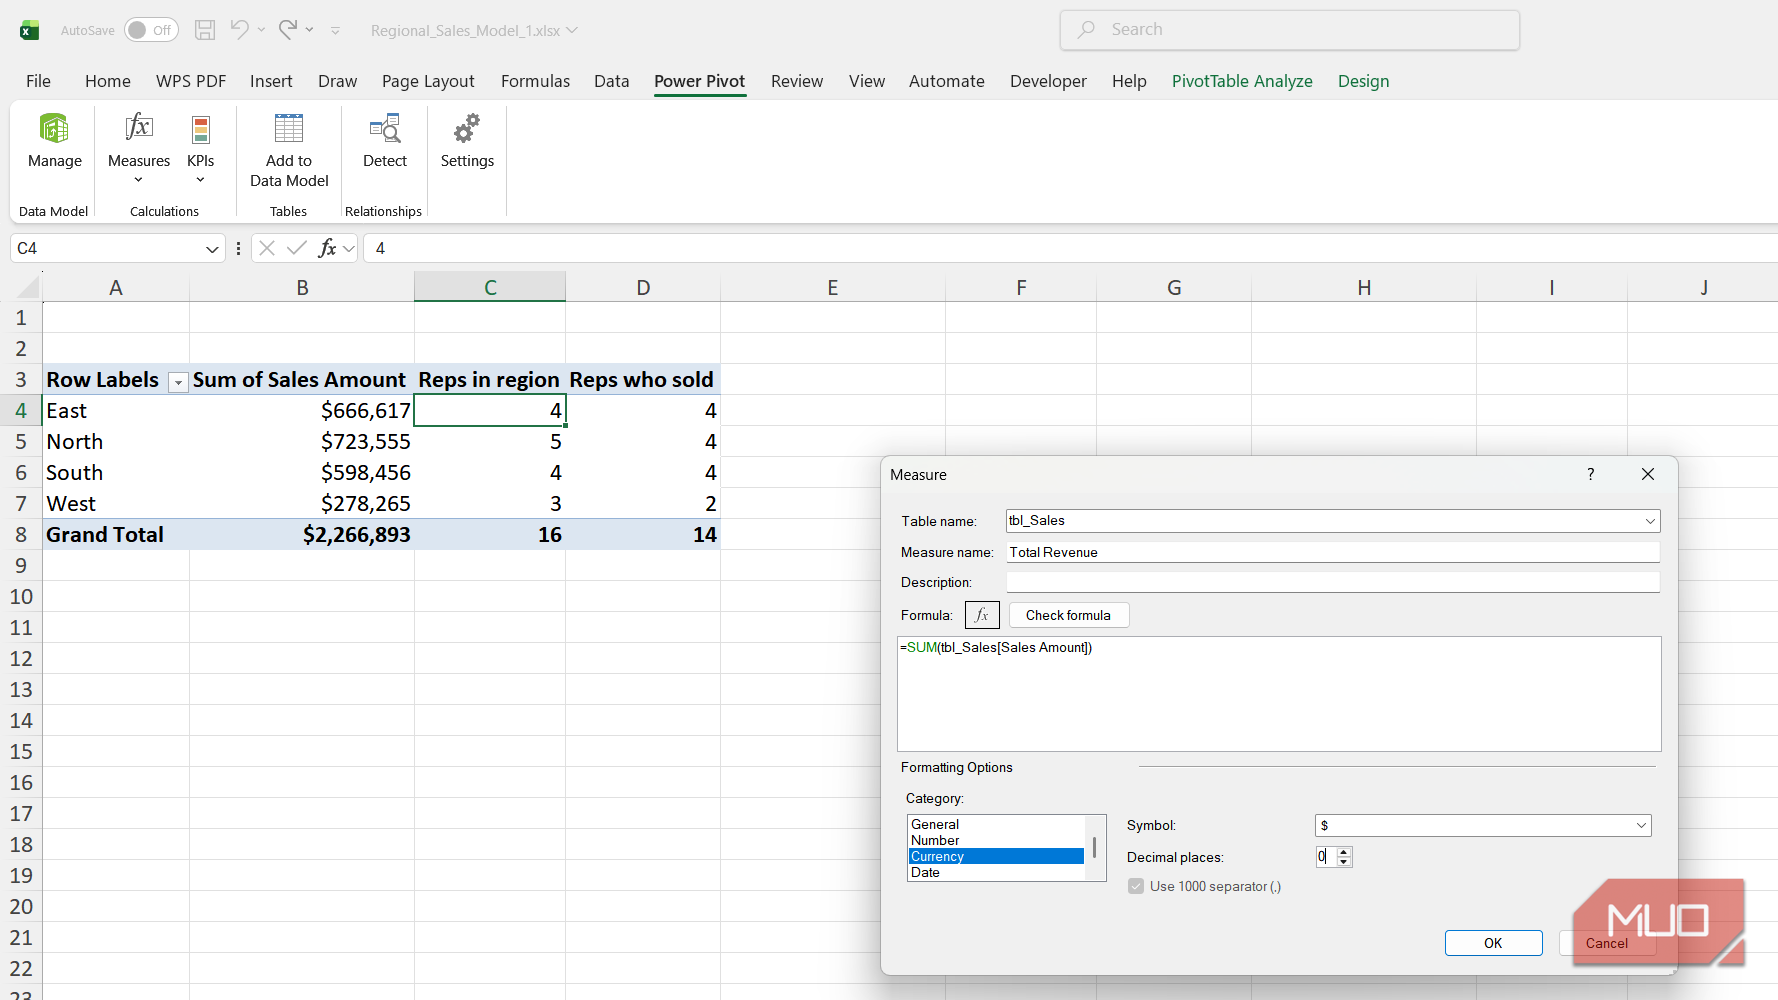
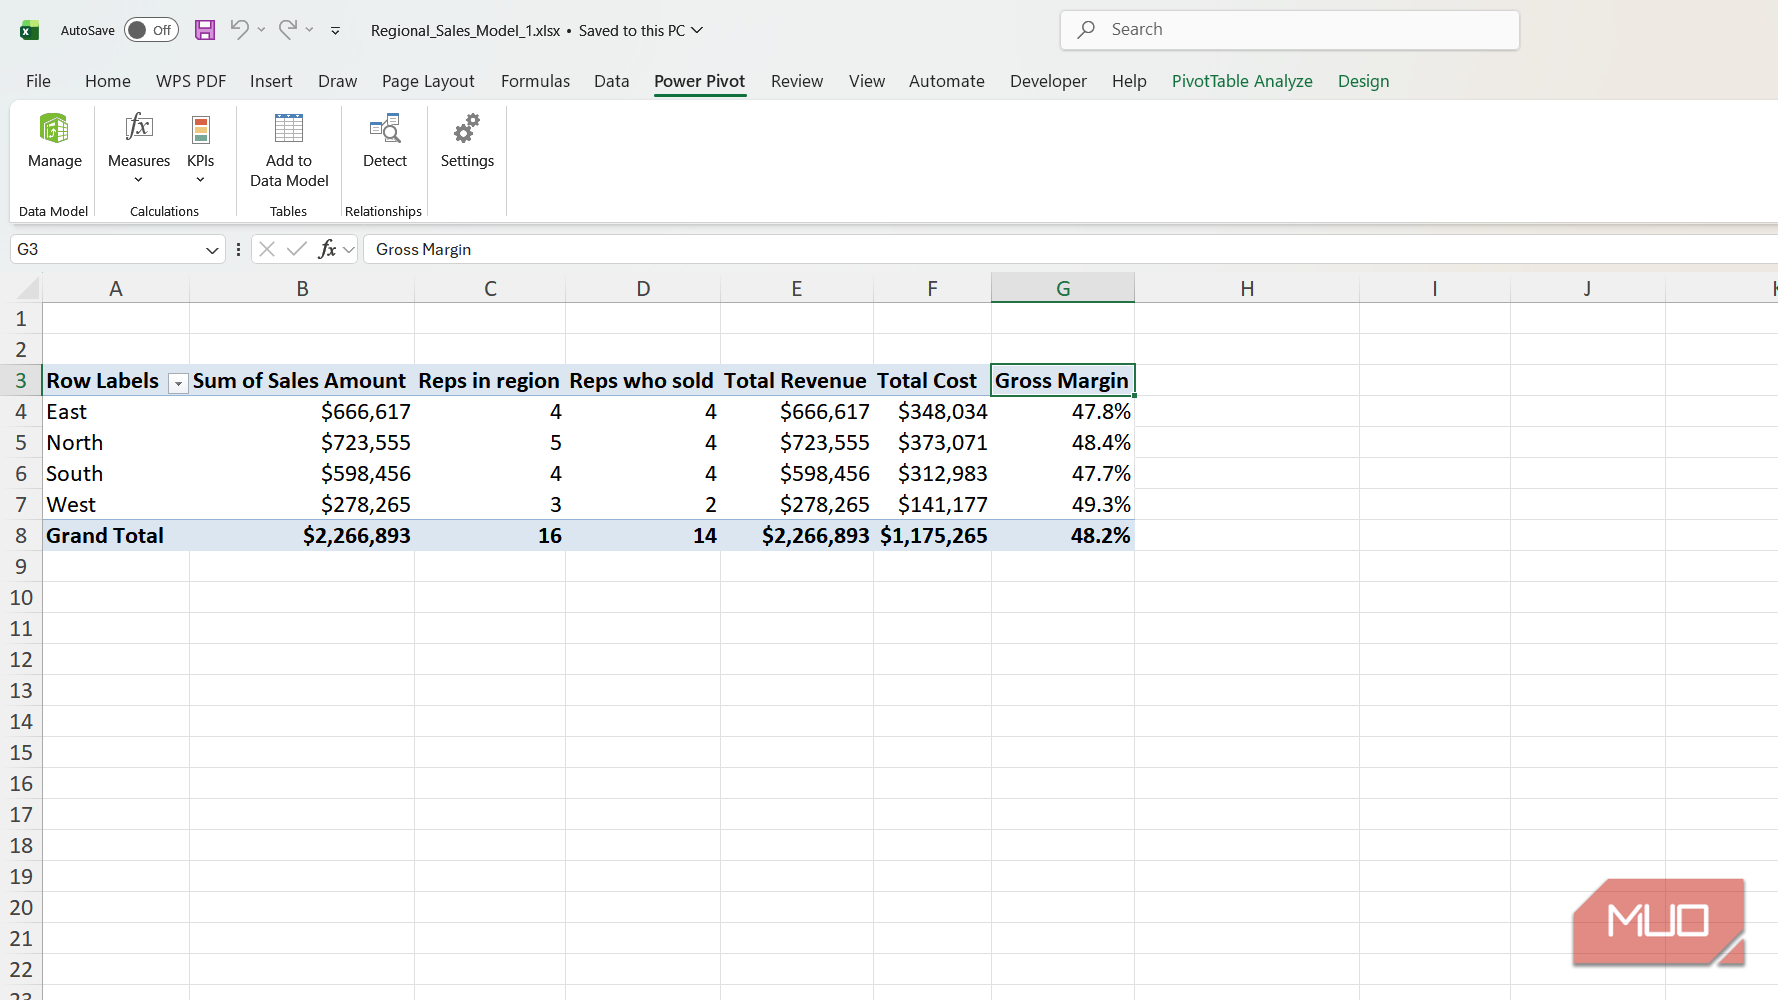
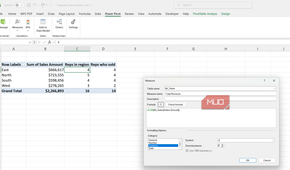
It answers a question ordinary PivotTables dodge. Four salespeople closed deals in North against a roster of five, and only two of West's three reps recorded a sale at all. Counting transactions would have shown four busy regions and completely hidden both gaps.
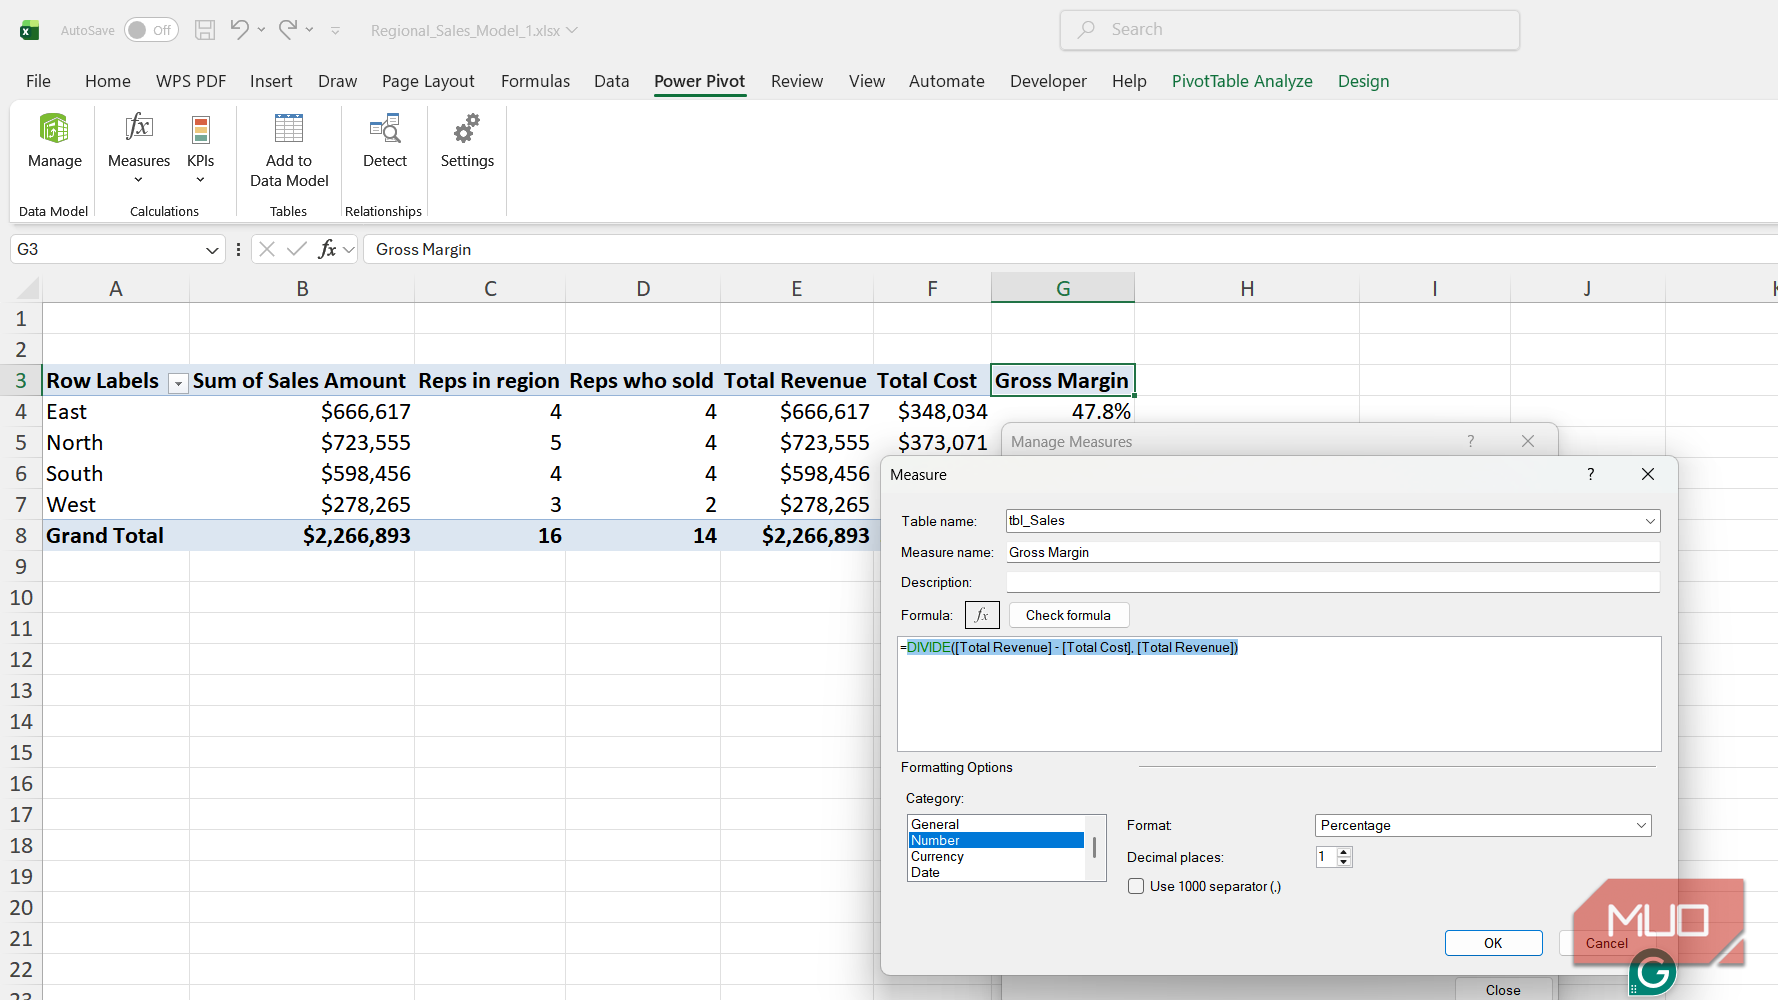
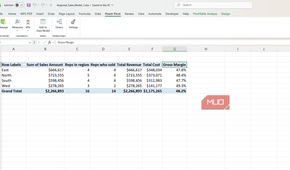
Measures go further still. A measure is written in DAX, stored in the model rather than attached to one PivotTable, and re-evaluated against whatever filters are active. Total revenue is a plain SUM across the sales table. Total cost is more interesting, because unit costs live on the products sheet. RELATED walks the relationship to fetch them, so no cost column ever gets copied into the sales data.
=DIVIDE([Total Revenue] - [Total Cost], [Total Revenue])
That lands at 48.2% across the full set and shifts the moment a slicer moves, because the measure recalculates inside whatever the report is currently showing rather than against a fixed range.
Calculated columns, KPIs, and hierarchies all live in the same place, and there is a fuller walkthrough of writing DAX measures that follow the relationships between tables if you want to push past these two. The model also compresses what it stores, so it is not bound by the worksheet ceiling of 1,048,576 rows.


Two tables are enough to start
What I'd add to this model next
Five tables make for a tidy demonstration, but they're nowhere near the entry point. Two sheets and one relationship is already a working model.
Mine is heading in two directions from here. The Calendar table is sitting there so year-over-year comparisons stop needing manual date columns, which is the next thing I want running properly. After that, pointing Power Query at a folder of monthly exports would let the same model refresh itself instead of being rebuilt each time.
And if the workbook ever outgrows Excel, the model exports into Power BI without starting over.

- OS
- Windows, macOS
- Supported Desktop Browsers
- All via web app
- Developer(s)
- Microsoft
- Free trial
- One month
- Price model
- Subscription
- iOS compatible
- Yes